
30 Jan Q4 2025
The primary investment themes of 2023 and 2024 continued in 2025. AI continues to dominate markets. Capital expenditures from AI hyperscalers (Alphabet, Amazon, Meta, Microsoft, and Oracle) are expected to increase from $241b in 2024 to about $400b in 2025. Spending projections continue to increase and are currently estimated at about $530b in 2026 and $600b in 2027 according to data published by JPMorgan analysts. Concentration in the market continues to increase. At the end of 2025 the largest 10 stocks in the S&P 500 comprised 41% of the index, an all-time high. This is up from previous all-time highs of 39% at the end of 2024 and 32% at the end of 2023. Equity markets also continue to be expensive in comparison to history, trading at a price to earnings ratio of about 22x, compared to historical averages closer to 17x.
One constant of investing is there is never a scarcity of things to worry about. Looking back over the last few years there were several factors driving concerns in the market. Inflation was at a 40-year high, and the Federal Reserve was hiking interest rates. The yield curve was inverted for over two years, from mid-2022 through late 2024. An inverted yield curve is a classic sign of upcoming recession, that in this case never materialized. Three large banks failed. Inflation remained sticky, causing consternation over future interest rates. And finally, tariffs created a new level of uncertainty for markets in early 2025. Against this backdrop, the S&P 500 return from 2023 – 2025 was the strongest three-year run since 1995-1997. Bonds also averaged a solid 4.5% – 5% annual return. The classic market adage that, “markets climb a wall of worry” certainly has been the case recently.
Risk management is the core of portfolio management, and proper risk management starts with the proper asset allocation. The chart below is an important depiction of the range of historical return outcomes over time.
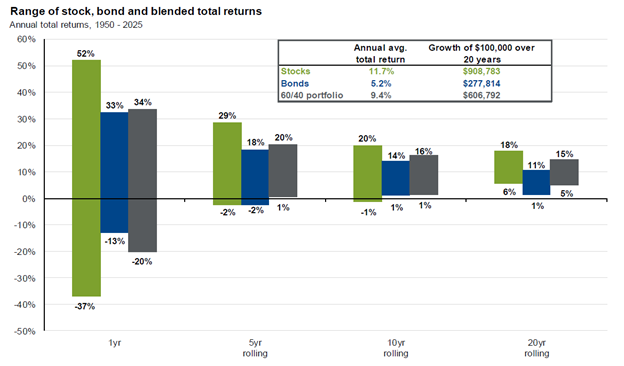
Source: JPMorgan Asset Management
As you can see, the range of outcomes over 1 year is wide, particularly for stocks. This band narrows over time, and a 60% stock / 40% bond portfolio has produced a positive annual return over a 5 year period during each instance of the last 75 years. Proper asset allocation is key to help avoid the worries that come with investing. Capital allocated to equities should have a long-term investment horizon, thereby avoiding the need to sell in market drawdowns.
Equity investors should expect a market decline at some point, especially after 3 consecutive years of strong returns. In fact, the average intra-year decline since 1980 is about 14% even though the market ended higher in 35 of those 46 years. Whether the next pullback comes from a current worry or something unknown, short-term capital should be invested in a manner that minimizes downside risk, allowing long-term capital the opportunity to find good investments during times of turbulence.
One interesting theme to watch in 2026 is the performance of quality stocks. There is no generally accepted definition of what determines a quality stock, however most would agree that low debt, high returns on equity and invested capital, high cash flow, and sustainable competitive advantages are at the top of the list of qualifications for quality. The Financial Times recently published data comparing the returns of quality stocks relative to the market over the last 30 years.
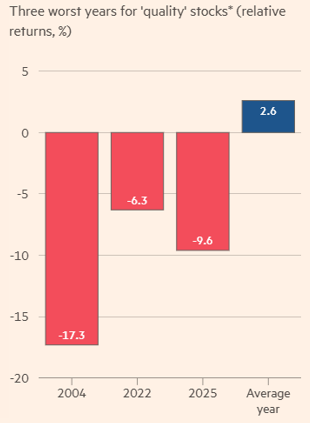
Source: The Financial Times
This study found that quality stocks have outperformed the rest of the market by 2.6% in an average year, however two of the last four years have produced the worst relative returns for quality stocks over the last 30. As investors move on from the risk-on mentality induced by AI, quality stocks appear poised to shine. A focus on quality permeates all of our investment portfolios, and we are well-positioned for this potential transition.
Please see below for portfolio commentary and trading activity.
Core Equity
The top four performing stocks for the year were all related to AI: Broadcom, Ciena, Quanta Services, and Alphabet. The worst performing stocks were Zebra Technologies, Constellation Brands, IQVIA, and Adobe. We sold Constellation Brands and IQVIA during the year and increased our positions in Zebra and Adobe. We added Intuit to the portfolio during the quarter, recognizing its dominant position in the consumer and small-to-mid-sized business (SMB) markets. Intuit maintains a wide economic moat built on high switching costs and data continuity across its core QuickBooks and TurboTax ecosystems, which command 85% and 80% market share in their respective categories. We believe Intuit is at a strategic turning point as an early adopter of AI, leveraging machine learning to pivot from simple DIY tools toward high-margin “assisted” services, such as TurboTax Live and the Intuit Enterprise Suite. This shift allows the company to capture share in the professional tax category and move upmarket into the mid-market ERP space.
A recap of trading activity for the full year:
- New positions: Quanta Services, Broadcom, Walmart, S&P Global, Colgate-Palmolive, Palo Alto Networks, Intuit
- Increased position size: Zebra Technologies, Thermo Fisher Scientific, Walmart, Adobe
- Exited positions: AMD, Aptiv, Booz Allen Hamilton, NXP Semiconductors, IQVIA, AES, Chart Industries, Constellation Brands, Ciena
- Decreased position size: Bank of America, JPMorgan Chase, Ciena, Broadcom
Covered Call
Our Covered Call portfolio is designed to provide a higher level of income and a lower level of volatility than a typical equity portfolio. Income continued to be strong in 2025 with approximately 9.8% call premium plus approximately 2.4% dividends for an approximate 12.2% total income yield. Income yield over the last ten years has averaged approximately 10.9% and has been within the range of 9.5% to 12.2% each year.
Diversified Income
Top performers in our Diversified Income portfolio in 2025 included Novartis, State Street, IBM, Old Republic, and Abbvie. Laggards included LyondellBasell, Kenvue, Whirlpool, and Target. The goal of the portfolio is to provide a sustainable income stream, and the portfolio generated an approximate income yield of 5.0% for the year.
A recap of trading activity for the full year:
- New positions: New positions: State Street, Allstate Preferred Series H, Kinder Morgan, HP, Texas Instruments, and Blackstone Secured Lending Fund
- Increased position size: General Mills, Target, UPS, Bristol-Myers Squibb, LyondellBasell
- Exited positions: Short-term Treasury ETF, Whirlpool, Cisco Systems, Kenvue, IBM
- Decreased positions: IBM, AT&T, Cisco Systems
Bonds
Interest rates trended down slightly throughout the year with the US 10 Year Treasury yield dropping from 4.57% to 4.17%. Our portfolio continues to focus on high-quality individual bonds with very low default risk. We ended 2025 with the portfolio yielding about 4.3% and an average time to maturity of slightly above five years.
Tom Searson, CFA
The analysis and performance information contained herein reflects that of portfolios used by Providence Capital Advisors, LLC, a Securities and Exchange Commission Registered Investment Advisor. This information should not be relied upon for tax purposes and is based upon sources believed to be reliable. No guarantee is made to the completeness or accuracy of this information. Providence Capital Advisors, LLC shall not be responsible for any trading decisions, damages, or other losses resulting from, or related to, the information, data, analyses or opinions contained herein or their use, which do not constitute investment advice, are provided as of the date written, are provided solely for informational purposes, and therefore are not an offer to buy or sell a security. This information has not been tailored to suit any individual.
Providence Capital Advisors, LLC does not guarantee the results of its advice or recommendations, or that the objectives of a strategy will be achieved. Portfolios offered by Providence Capital Advisors, LLC may not have contained and/or may not currently contain the same underlying holdings and may have been and/or may currently be managed according to rules or restrictions established by Providence Capital Advisors, LLC. The income numbers for Covered Call and Diversified Income are based on one portfolio in the composite that serves as the model portfolio. Actual income returns may be different for other portfolios. Employees of Providence Capital Advisors, LLC may have holdings in the securities and/or utilize the same portfolio strategies as presented herein.
Benchmark returns are used for comparative purposes only and are not intended to directly parallel the risk or investment style of the accounts included in our investments. The volatility of the indices compared herein may be materially different from that of the compared Providence Capital Advisors, LLC strategy. There is no guarantee that the strategies will outperform, or even match, benchmark returns over the long term.
This commentary contains certain forward-looking statements. Forward-looking statements involve known and unknown risks, uncertainties and other factors which may cause the actual results to differ materially and/or substantially from any future results, performance or achievements expressed or implied by those projected in the forward-looking statements for any reason.
Past performance is not indicative of future results. Therefore, no current or prospective client should assume that future performance of any specific investment or investment strategy (including the investments and/or investment strategies recommended or undertaken by Providence Capital Advisors, LLC) will be profitable or equal the corresponding indicated performance level(s). Different types of investments involve varying degrees of risk, and there can be no assurance that any specific investment will either be suitable or profitable for a client or prospective client’s investment portfolio. Historical performance results for investment indices and/or categories generally do not reflect the deduction of transaction and/or custodial charges, the deduction of an investment management fee, nor the impact of taxes, the payment of which would have the effect of decreasing historical performance results.