
08 Oct Q3 2026
We decided to change the flavor of our newsletter this quarter and widen the authorship. We’ve received many inbound questions about bonds in the current interest rate environment, and Brian Alderson is going to dive into some of the intricacies of bond math. Jeff Serbin is then going to share some insights learned during the Goldman Sachs Technology Conference in San Francisco. As always, we’ll conclude with portfolio commentary and trading activity. Hope you enjoy!
Bond Math: Why Prices Move and Why It Matters Less Than You Think
It seems there have been increasingly ominous headlines around fixed income investing, and investors are asking questions about how price swings affect their portfolios. Bond math can seem complex on the surface, but the underlying intuition is straightforward. I will use a simple example of a bond investment to walk through how pricing works, what risks matter, and how this impacts our strategy at PCA.
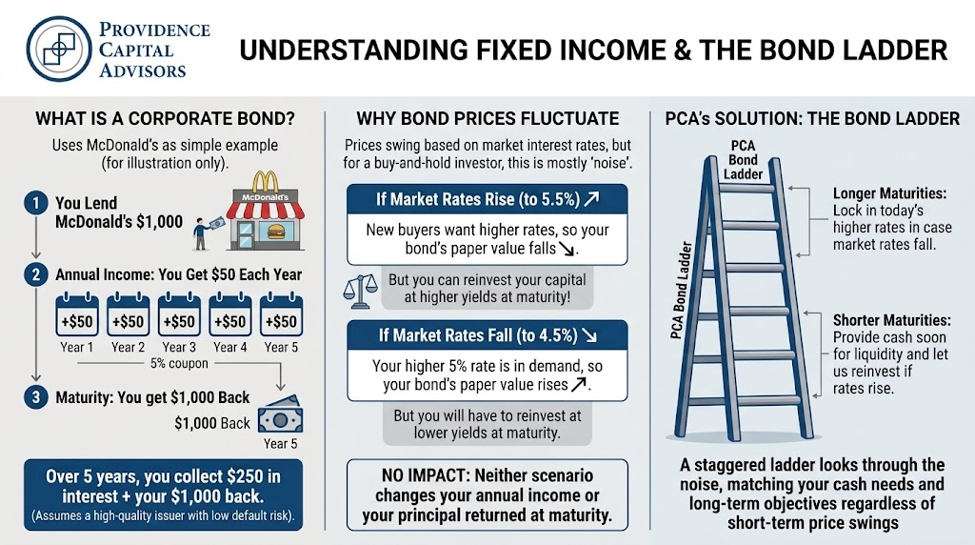
What is a corporate bond? A corporate bond is a loan to a company that is divided among many individual investors rather than held by a single bank or lender. Let’s use a hypothetical bond from McDonald’s Corporation as an example. McDonald’s is looking for capital to fund projects that they hope will create future growth for the company. They issue a corporate bond maturing in 5 years with a 5% coupon.
- Your initial investment: You lend McDonald’s $1,000
- Annual Income: McDonald’s pays you $50 per year (5% of $1,000) for 5 years.
- Maturity: At the end of year 5, McDonald’s returns your $1,000 principal.
If you hold this bond to maturity, you will receive $250 in interest payments and the full $1,000 of principal back. This assumes the company does not default, which is why we focus on high-quality companies with low default risk.
Why do the prices of bonds fluctuate?
- Scenario 1: Market interest rates rise to 5.5%. If a new buyer can get an interest rate of 5.5% elsewhere, they would only be willing to buy your 5% bond at a discount. This would cause the value of your bond to fall.
- Scenario 2: Market interest rates fall to 4.5%. If a new buyer can only buy bonds at 4.5%, they would be willing to pay you a premium to have your 5% bond. This would cause the value of your bond to rise.
If your initial goal was to buy the McDonald’s bond, collect a 5% interest payment and have your money returned to you, neither of these interest rate changes affects your income or the principal returned at maturity. You are what is known as a buy-and-hold investor. The daily price changes of your investment are just noise. The fluctuation of the price of your bond while you own it means your total return will not be 5% each year, but it will average 5% per year over the life of the bond.
Reinvestment risk is how changing interest rates affect buy-and-hold investors: it shows up when they reinvest the proceeds of their bond maturity into a new bond. The two scenarios above represent two different outcomes of reinvestment risk. In Scenario 1 interest rates rose, causing you to have paper losses along the way, but upon maturity you can reinvest at higher yields. In Scenario 2 you had paper gains along the way, but upon maturity your principal must now be reinvested at lower yields.
This is the key thought process to how we ladder bond portfolios at PCA. Most clients have bonds maturing in roughly even increments. Some mature soon, which provides cash when needed and lets us reinvest if rates rise. Others mature many years out, which locks in today’s higher rates in case rates fall. The length of these bond ladders can change over time based on portfolio management decisions. In the low-rate pandemic era, we purposefully kept maturities short to avoid locking in historically low yields. As yields have risen, we have extended maturities to lock in higher yields.
Recent articles reflect investor anxiety over higher inflation and shifting interest rate expectations. Our approach is designed to look through the noise and build fixed income portfolios to meet the liquidity needs and long-term objectives of our clients regardless of short-term price swings.
Interest rates aren’t the only topic filling headlines. On the stock side, the conversation is dominated by artificial intelligence and the companies building it.
What We Learned From 30+ Technology Leaders
Technology is now the largest sector of the U.S. stock market, making up 39.6%¹ of the S&P 500. This number actually understates the size because companies such as Alphabet (Google), Amazon, Meta (Facebook), and Tesla are not included in the technology sector. When these four companies are added the percentage jumps to 53.0%1 of the S&P 500. Because this one area of the market has such a large effect on portfolio results, we make a point of hearing directly from the people running these companies.
In September, I attended the Goldman Sachs Communacopia + Technology Conference, where more than 30 company leaders presented over three days. That included companies we own, companies we follow closely, and several we were studying for the first time. Hearing from management in person lets us see how executives handle difficult questions, not just their prepared remarks, and lets us compare what dozens of companies say side by side. Where their stories agree, we gain confidence. Where they conflict, we know where to dig further.
One reminder we keep in mind: presenting companies are naturally enthusiastic about their own products, so we weigh what we hear against what each speaker has to gain. With that lens, here are four themes that stood out.
1. The spending is enormous. The payoff is still uncertain.
Artificial Intelligence (AI) came up in nearly every session. Large technology companies are spending hundreds of billions of dollars on data centers, the warehouse-sized buildings full of computers that run AI. By every account we heard, that spending is real and continuing.
What is less clear is who will earn a return on investment. One semiconductor CEO walked through the math on stage: a large AI data center may generate about $30 billion in annual revenue, but roughly two-thirds of that goes to the companies building AI models and applications. That leaves a much smaller share to be divided among chipmakers, cloud providers, and power suppliers. Separately, a company that helps businesses manage their data told us its customers’ AI costs are rising quickly, and most are not yet seeing benefits to match.
These observations don’t settle whether AI is overhyped. What they tell us is that it is early. The spending shows up first. The question of which businesses ultimately profit takes longer to answer.
2. Physical limits are setting the pace.
We expected to hear that a shortage of computer chips was the main constraint. Instead, speaker after speaker pointed to something more basic: electricity, construction, and permits. A data center cannot run until it is connected to enough power, and new power connections can take years. Several companies described customers spreading a single project across multiple locations simply because no one site had enough power available.
This is a constraint we are watching closely since it affects how quickly spending turns into finished projects.
3. Security matters more as AI spreads.
Nearly every company we heard from raised the topic of cybersecurity. AI helps attackers too: it can write convincing scam emails, find weaknesses faster, and operate at a scale that was not possible before. At the same time, businesses are starting to use AI “agents,” software that can take action on its own, such as approving an invoice or updating a customer record. Companies told us they worry about agents completing a task in a way no one intended, so each one needs to be monitored, and each is another door that needs a lock. The companies we heard from described security less as an optional add-on and more as a basic cost of adopting AI.
4. AI may change how software companies make money.
Software has traditionally been an unusually profitable business. A program costs a lot to build, but selling one more copy costs almost nothing, so profits grow quickly as sales grow. AI changes that math. Every time someone uses an AI feature, it costs real money in computing power. Several software companies told us they are accepting somewhat lower profit margins on AI features and expect to make up the difference elsewhere in their business.
This is changing how we evaluate software companies, since some of the traditional measuring sticks may point in the wrong direction during this transition.
How this shapes our portfolios
Nothing we heard called for a sudden change in approach, and that is by design. Our portfolios already reflect the view that AI is a real trend whose long-term winners are not yet settled. In practice, that means:
- We own a diversified mix of technology and technology-related companies rather than concentrating on a single part of the AI story. For example, we own large cloud computing providers (Microsoft, Alphabet, and Amazon), chip designers (Nvidia and Broadcom), companies that build power and electrical infrastructure (Quanta Services and Eaton), and cybersecurity (Palo Alto Networks). Alphabet also develops its own family of AI models know as Gemini.
- We favor companies earning profits today over those whose value depends mostly on future AI payoffs.
- We stay mindful of how much of the overall market is concentrated in technology and size our positions with that in mind.
The conference sharpened the questions we will be asking in the months ahead, particularly who earns a return on all this spending and how software businesses adapt. We will keep doing that work and adjust portfolios as necessary.
Portfolio Commentary and Trading Activity
Core Equity
Top-performing stocks during the quarter included Zebra Technologies, Microsoft, Thermo Fisher Scientific, and Dexcom. Laggards included Home Depot, Brookfield Corporation, and Xylem. During the quarter, we increased our position sizes in Walmart and TJX Companies. Although consumer sentiment surveys show a depressed shopper, consumer spending continues to grow. We believe both companies are well-positioned to navigate a complex consumer environment, and both stocks offered an attractive point to increase our positions. We trimmed Palo Alto Networks after strong performance to manage position size. We continue to view cybersecurity as a long-term beneficiary of AI adoption. A recap of trades during the quarter:
- New position: BAE Systems
- Increased position size: Walmart, TJX Companies
- Decreased position size: Palo Alto Networks, Zebra Technologies, Thermo Fisher Scientific
Covered Call
On average, five to six options expire each month in our Covered Call portfolio. If the option expires worthless, we typically sell another option on the same stock. If the stock price is above the option strike, and the underlying stock is called away, we typically replace the holding with a new covered call position. Trading activity during the quarter:
- New positions: Microchip Technology, Citigroup, Amazon, O’Reilly Automotive, Procter & Gamble, Zimmer Biomet
- Option rewrites: Nike, Boston Scientific, Nvidia, ExxonMobil, Progressive, Accenture, Netflix, Microchip Technology, IBM, Emerson Electric
- Positions called away: Qualcomm, Wells Fargo, Medtronic, Sysco, Zimmer Biomet
- Positions sold: Comcast
Diversified Income
Top-performing positions during the quarter included HP Inc., Chevron, Target, Pfizer, and AT&T. Laggards included Nike, Southern, American Electric Power, and UPS. Trading activity during the quarter:
- New positions: PepsiCo, Global X S&P 500 Covered Call ETF, Tyson Foods, McDonald’s
- Increased position size: AT&T, Sanofi
- Exited positions: Coca-Cola, iShares 20+ Year Treasury Bond ETF
- Decreased position size: Target, AbbVie
¹ Bloomberg 500 Index (SPX proxy), as of 9/30/2026
Tom Searson, CFA
The analysis and performance information contained herein reflects that of portfolios used by Providence Capital Advisors, LLC, a Securities and Exchange Commission Registered Investment Advisor. This information should not be relied upon for tax purposes and is based upon sources believed to be reliable. No guarantee is made to the completeness or accuracy of this information. Providence Capital Advisors, LLC shall not be responsible for any trading decisions, damages, or other losses resulting from, or related to, the information, data, analyses or opinions contained herein or their use, which do not constitute investment advice, are provided as of the date written, are provided solely for informational purposes, and therefore are not an offer to buy or sell a security. This information has not been tailored to suit any individual.
Providence Capital Advisors, LLC does not guarantee the results of its advice or recommendations, or that the objectives of a strategy will be achieved. Portfolios offered by Providence Capital Advisors, LLC may not have contained and/or may not currently contain the same underlying holdings and may have been and/or may currently be managed according to rules or restrictions established by Providence Capital Advisors, LLC. The income numbers for Covered Call and Diversified Income are based on one portfolio in the composite that serves as the model portfolio. Actual income returns may be different for other portfolios. Employees of Providence Capital Advisors, LLC may have holdings in the securities and/or utilize the same portfolio strategies as presented herein.
Benchmark returns are used for comparative purposes only and are not intended to directly parallel the risk or investment style of the accounts included in our investments. The volatility of the indices compared herein may be materially different from that of the compared Providence Capital Advisors, LLC strategy. There is no guarantee that the strategies will outperform, or even match, benchmark returns over the long term.
This commentary contains certain forward-looking statements. Forward-looking statements involve known and unknown risks, uncertainties and other factors which may cause the actual results to differ materially and/or substantially from any future results, performance or achievements expressed or implied by those projected in the forward-looking statements for any reason.
Past performance is not indicative of future results. Therefore, no current or prospective client should assume that future performance of any specific investment or investment strategy (including the investments and/or investment strategies recommended or undertaken by Providence Capital Advisors, LLC) will be profitable or equal the corresponding indicated performance level(s). Different types of investments involve varying degrees of risk, and there can be no assurance that any specific investment will either be suitable or profitable for a client or prospective client’s investment portfolio. Historical performance results for investment indices and/or categories generally do not reflect the deduction of transaction and/or custodial charges, the deduction of an investment management fee, nor the impact of taxes, the payment of which would have the effect of decreasing historical performance results.