
27 Jul Q2 2026
One notable event during the 2nd quarter was the initial public offering (IPO) of SpaceX. SpaceX had been a privately held company since its founding in 2002 and had long sworn off a public listing. The need for capital and favorable market backdrop caused a change in the company’s plans. SpaceX’s IPO raised an astounding $86 billion, more than 3 times the previous largest IPO.
SpaceX’s ambitious goals and unique thinking resulted in the company developing rocket boosters that could return to earth and be re-used. This marvel of engineering and other advancements helped cut the costs of space flights by about 85%. The company now carries almost 90% of what goes into space.
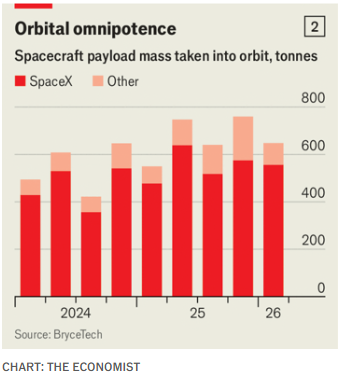
In addition to the rocket business, SpaceX operates Starlink, which has 10,000 satellites (2/3 of total in orbit), over 12 million customers, and made $4.4 billion in operating profit last year. The company is dominating space and creating significant cash flow at Starlink. Why did it decide to raise so much capital through its IPO?
The reason is that AI is expensive. Very expensive. SpaceX’s AI business, xAI, is investing to keep up with the behemoth frontier AI labs, Open AI (Chat GPT) and Anthropic (Claude). Based on the most recent regulatory filing on March 31, SpaceX is burning through over $1 billion in cash per month. The company sees AI as the core of its future. In fact, it disclosed in its IPO prospectus a total addressable market of $28.5 trillion, 93% of which is its AI segment. For context, $28.5 trillion is almost the size of the entire U.S. economy.
We fielded some calls regarding our opinion on an investment in SpaceX. The valuation of the shares at the IPO price of $135 was almost 100x last year’s sales. As a comparison, the S&P 500 trades at about 3x sales. Sky-high (pun intended) valuations inherently come with sky-high expectations, and stocks suffer when expectations are not met. In addition, the IPO prospectus outlined how company insiders and early investors could begin selling shares in the next few months, much more quickly than the typical timeframe for IPOs. An expensive valuation and potential upcoming wave of selling lead us to believe that the risk/reward was not favorable for those looking to buy at or shortly after the IPO. Essentially, a great company does not always equal a great investment. That advice did not look correct in the first 3 days of trading as the shares skyrocketed from $135 to over $200. The advice does look a little better now with the stock down over 50% from its high and about 17% below its IPO price.
SpaceX has only been trading for about 6 weeks, and investment decisions should not be measured in that short of a time frame. The stock absolutely could be a more attractive investment at some point in the future. More important than the share price of SpaceX, in my opinion, is what the IPO says about capital needs for AI investment and the enthusiasm in the market for risk.
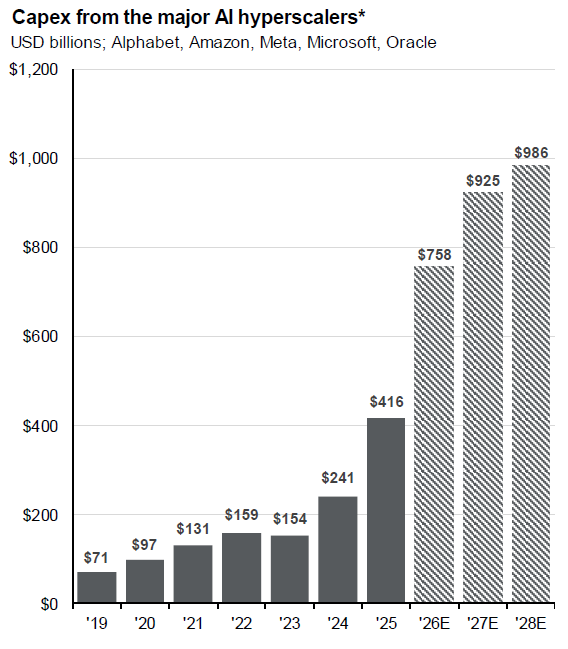
The term hyperscaler refers to companies with massive data center footprints offering cloud services and AI compute. The 5 large U.S. hyperscalers are Amazon, Alphabet (Google), Microsoft, Meta (Facebook), and Oracle. These companies are projected to spend approximately $750 billion in capital expenditures in 2026 with continued increases expected for the next few years.
Source: JPMorgan Asset Management
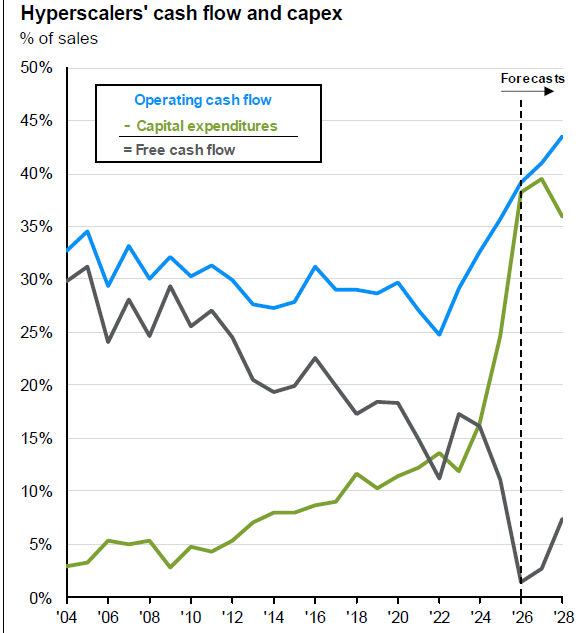
Companies typically cover capital expenditures with operating cash flow, however the magnitude of the spending is driving free cash flow near zero for these internet behemoths that generate enormous sums of operating cash flow.
Source: JPMorgan Asset Management
Companies must therefore raise capital to fund these capital expenditures. All five of these companies have been issuing debt, and Alphabet announced a historic $85 billion equity capital raise. Anthropic and OpenAI are expected to keep the party going with IPOs later this year or early next year.
Greed and fear ebb and flow in markets over time. The ability of SpaceX and the hyperscalers to raise these massive amounts of capital show that greed clearly dominates fear at the moment.
Another interesting example of market exuberance is memory chips. Memory chips were historically commodity products characterized by boom and bust cycles. The industry is dominated by 3 companies: Micron, SK Hynix, and Samsung. Using Micron as an example, over the last 25 years, revenues have decreased in 9 years and free cash flow has been negative in 7 years. This means that over 1/3 of the time, sales went down and over ¼ of the time, the company was not producing free cash flow. In fact, cumulative total free cash flow over the last 25 years was earned in just 3 ½ years. Total cash flow from the other 21 ½ years was approximately zero. The large AI capital investments referenced earlier caused a supply/demand mismatch in memory chips last year. Micron’s stock reacted by going up over 800% from June 30, 2025 through June 30, 2026. That level of stock appreciation in a company that has historically gone through boom and bust cycles is another sign of greed dominating fear.
The last example of market exuberance we would like to discuss is borrowing on margin. Margin debt is when investors use the value of their investment accounts to borrow money. This money is typically, but not always, used to purchase more securities. Margin debt tends to increase as asset values increase and is another sign of greed in markets. The charts below certainly indicate some froth.
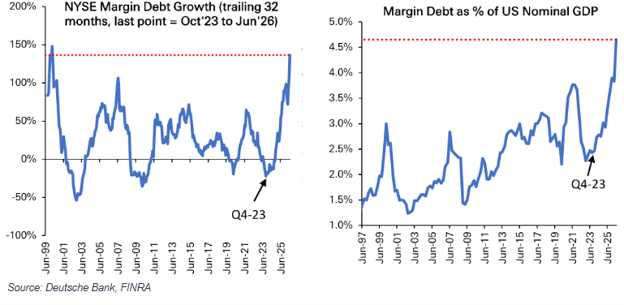
I do not share these examples because we think we are in a bubble. We continue to search for and find investment opportunities that we believe offer attractive growth opportunities. The point in sharing these examples is that we believe there are pockets of exuberance in financial markets. When these pockets are present, risk management becomes of supreme importance. As always, we will manage the portfolios in a manner that properly balances the potential upside of an investment in conjunction with corresponding risk.
Please see below for portfolio commentary and activity.
Core Equity
Top performing stocks during the quarter included Palo Alto Networks, Quanta Services, Zebra Technologies, Alphabet, and Broadcom. Laggards include Intuit, Abbott Labs, and SLB. Dexcom was a new addition to the portfolio during the quarter. The company makes Continuous Glucose Monitors, which we believe have multiple investment tailwinds including the rising global prevalence of diabetes, pending Medicare coverage expansion, and expanding the sensors beyond glucose. Palo Alto Networks was our top performing holding during the quarter. We purchased the stock in December of last year and increased our position size in February. The company is one of the world’s largest cybersecurity companies and has benefited from increased risks of AI-enabled attacks. A recap of trades during the quarter:
- New positions: Dexcom
- Increased position size: Lonza, Stryker, Amazon, Xylem
- Exited positions: Abbott Labs, Intuit
- Decreased position size: Quanta Services
Covered Call
On average, five to six options expire each month in our Covered Call portfolio. If the option expires worthless, we typically sell another option on the same stock. If the stock price is above the option strike, and the underlying stock is called away, we typically replace the holding with a new covered call position. Trading activity during the quarter:
- New positions: Progressive, Accenture, Nvidia, ExxonMobil, IBM, Sysco, Lowe’s, Emerson Electric, Netflix, Waste Management
- Option rewrites: Boston Scientific, Comcast, MetLife, Wells Fargo, Medtronic, Kroger, Zimmer Biomet
- Positions called away: PepsiCo, Texas Instruments, Nvidia, Cisco Systems, Phillips 66, Amazon, Dell Technologies, Union Pacific, Carrier, MetLife, Starbucks
Diversified Income
Top performing positions during the quarter included Texas Instruments, State Street, U.S. Bancorp, Abbvie, and Hewlett Packard. Laggards included LyondellBasell, AT&T, Chevron, and Verizon. Trading activity during the quarter:
- New positions: Nike, American Tower, Brookfield Asset Management
- Increased position size: High Yield Corporate Bond ETF, Prudential, Sanofi, Hewlett Packard
- Exited positions: State Street, General Mills, Crown Castle
- Decreased Position Size: Texas Instruments, American Electric Power
Tom Searson, CFA
The analysis and performance information contained herein reflects that of portfolios used by Providence Capital Advisors, LLC, a Securities and Exchange Commission Registered Investment Advisor. This information should not be relied upon for tax purposes and is based upon sources believed to be reliable. No guarantee is made to the completeness or accuracy of this information. Providence Capital Advisors, LLC shall not be responsible for any trading decisions, damages, or other losses resulting from, or related to, the information, data, analyses or opinions contained herein or their use, which do not constitute investment advice, are provided as of the date written, are provided solely for informational purposes, and therefore are not an offer to buy or sell a security. This information has not been tailored to suit any individual.
Providence Capital Advisors, LLC does not guarantee the results of its advice or recommendations, or that the objectives of a strategy will be achieved. Portfolios offered by Providence Capital Advisors, LLC may not have contained and/or may not currently contain the same underlying holdings and may have been and/or may currently be managed according to rules or restrictions established by Providence Capital Advisors, LLC. The income numbers for Covered Call and Diversified Income are based on one portfolio in the composite that serves as the model portfolio. Actual income returns may be different for other portfolios. Employees of Providence Capital Advisors, LLC may have holdings in the securities and/or utilize the same portfolio strategies as presented herein.
Benchmark returns are used for comparative purposes only and are not intended to directly parallel the risk or investment style of the accounts included in our investments. The volatility of the indices compared herein may be materially different from that of the compared Providence Capital Advisors, LLC strategy. There is no guarantee that the strategies will outperform, or even match, benchmark returns over the long term.
This commentary contains certain forward-looking statements. Forward-looking statements involve known and unknown risks, uncertainties and other factors which may cause the actual results to differ materially and/or substantially from any future results, performance or achievements expressed or implied by those projected in the forward-looking statements for any reason.
Past performance is not indicative of future results. Therefore, no current or prospective client should assume that future performance of any specific investment or investment strategy (including the investments and/or investment strategies recommended or undertaken by Providence Capital Advisors, LLC) will be profitable or equal the corresponding indicated performance level(s). Different types of investments involve varying degrees of risk, and there can be no assurance that any specific investment will either be suitable or profitable for a client or prospective client’s investment portfolio. Historical performance results for investment indices and/or categories generally do not reflect the deduction of transaction and/or custodial charges, the deduction of an investment management fee, nor the impact of taxes, the payment of which would have the effect of decreasing historical performance results.