
31 Oct Q3 2022
The difficult start to the year in financial markets continued in the third quarter as stocks and bonds both posted negative returns. One unique aspect of the current market turbulence is the lack of portfolio support provided by bonds. Bond prices often increase during stock market declines, providing a stabilizer to a balanced portfolio. Interest rates and bond prices move inversely, therefore bond prices have declined sharply as interest rates have increased. As a point of reference for a balanced portfolio, a portfolio of 50% stocks and 50% US Government bonds has now experienced its worst drawdown since 1974, according to a report by Deutsche Bank.
The Federal Reserve continues to increase interest rates in an attempt to tame inflation, and inflation and interest rates continue to drive markets. Stock prices were positive during the quarter until inflation data for August was released on September 13th. August inflation readings were higher than expected, causing the markets to price in more interest rate increases from the Federal Reserve. We receive inflation data for September on Thursday of this week, which could cause markets to move significantly if inflation was higher or lower than expectations.
The Fed is likely to continue raising interest rates until inflation and the labor market both soften. Although a softening labor market equates to higher unemployment, the Fed has clearly communicated that this pain is necessary in order to prevent a wage-price spiral and continued inflation. Increases in the Fed Funds rate have historically preceded recessions, and at this point markets expect a recession over the next six to twelve months. The question is whether the recession will be shallow or whether interest rate increases continue to a level that causes a deep or prolonged recession. As we discussed in our last quarterly newsletter, commodity price decreases, excess inventory at retailers, a strong US Dollar, and easing supply chain pressures should all begin to dampen prices. The first signs of labor market softening are also appearing, as the number of job openings declined recently. In addition, mortgage rate increases are slowing the housing market. 30-year fixed mortgage rates bounced around 3% for the second half of 2020 and most of 2021. At that rate a buyer putting down 20% could buy a $500,000 home with a monthly payment of about $1,700. 30-year fixed mortgage rates are now roughly 7%. At this rate, the same $1,700 payment buys a $315,000 home (again, assuming 20% down payment). Aggregate demand is slowing, and inflation should slow, however the time until these variables feed through to the point that the Fed can stop raising rates is unknown.
Difficulties often breed opportunities, and the pullback in both stock and bond prices present investment opportunities that were not available during recent times of high stock valuations and low interest rates. Let’s start with the stock market. Stock prices are a function of company earnings and a multiple placed on those earnings. As you can see in the chart below, the Price to Earnings multiple has decreased 30% this year and is now below its 25-year average.
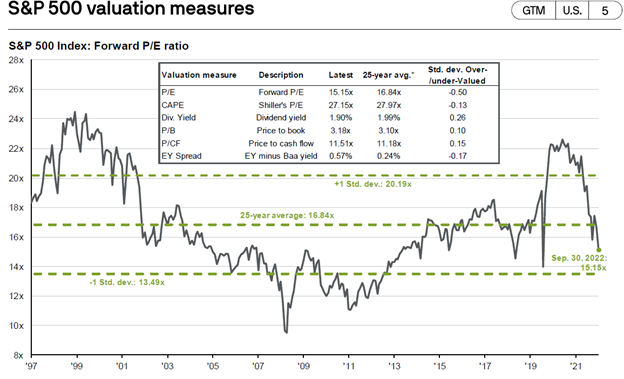
Lower valuations certainly do not guarantee market bottoms, but they do provide more long-term investment opportunities than times of higher valuation multiples.
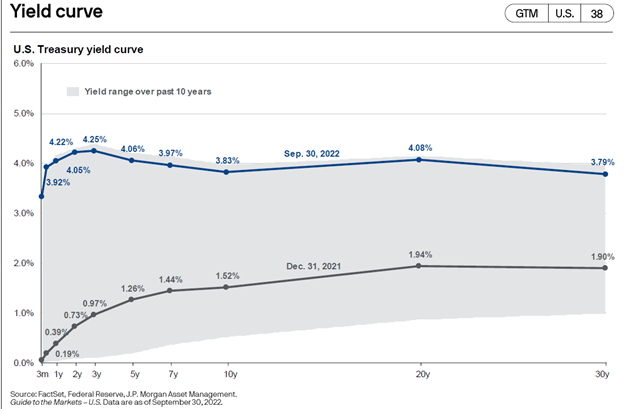
The increase in interest rates has provided opportunities in the bond market that have not existed for quite some time. The chart below shows the US Treasury yield curve which plots yields of different maturities of US Treasury bonds. The grey line shows the yield curve at the beginning of the year. At that time a 2-year bond yielded 0.73%, a 5-year bond 1.26%, and a 10-year bond 1.52%. The blue line shows the yield curve on September 30th. Yields increased to 4.22% for a 2-year bond, 4.06% for a 5-year bond, and 3.83% for a 10-year bond. These increases are dramatic moves in bond markets. The light grey shaded area shows the yield range over the past 10 years. Current interest rates are all at the top of the range during this time period.
Market tops and bottoms are impossible to predict, but current levels likely provide opportunities to make good long-term investments. In times of stress it is important to reiterate that we do not speculate or guess on what a stock, bond, or market will do. We do not attempt to call market tops or bottoms. Based on diligent research, we invest in companies that we believe offer attractive growth opportunities at reasonable prices and strive for long-term investment success.
Please see below for commentary and trading activity in our three equity portfolios.
Core Equity
Top performing holdings in the Core Equity Portfolio during the quarter were Xylem, AES Corp, Eaton, and Amazon. The worst performing stocks included Grocery Outlet, Pfizer, and Prologis. We added five new stocks to the portfolio during the quarter, one of which was Deere. Russia’s invasion of Ukraine and the associated volatility in agricultural commodities has placed a spotlight on food security for all countries across the globe. Deere’s focus on precision farming and autonomous equipment provides a direct answer for greater farming efficiency. Not only does this focus on automation benefit from long-term secular drivers, it also positively impacts Deere’s business model by shifting more revenues to recurring subscription-based contracts. This shift decreases the cyclicality of the company’s revenue stream. Pullbacks in the overall market can often provide opportunities to purchase high-quality companies at lower valuations. At the time of the purchase, the stock had decreased over 20% from its peak earlier in the year, and the P/E multiple on the stock had compressed from 18x earlier in the year to about 14x. The purchase of Deere is an example of how we attempt to be opportunistic during times of volatility.
Trading activity during the quarter:
- New positions – Advanced Micro Devices, Nvidia, Johnson Controls, Deere, and Schlumberger
- Increased position size – Advanced Micro Devices
- Exited positions – Honeywell, Target, Phillips 66
- Decreased position size – Grocery Outlet, Apple, Thermo Fisher Scientific
Covered Call
On average, five to six options expire each month in our covered call portfolio. If the option expires worthless, we typically sell another option on the same stock. If the stock price is above the option strike, and the underlying stock is called away, we typically replace the holding with a new covered call position. Market pullbacks result in many more options expiring worthless than positions called away.
Trading activity during the quarter:
- New positions – Johnson & Johnson
- Positions called away – Starbucks
- Option rewrites – Oracle, Dover, Lowe’s, TJX Companies, PepsiCo, Apple, DuPont, Intel, Comcast, Baxter, State Street, Citigroup, Disney, Corning, and Medtronic
Diversified Income
Top performing holdings in the Diversified Income portfolio were STORE Capital, General Mills, and Truist Financial Preferred Series R. Laggards were AT&T, Verizon, and Sanofi. There are two interesting items to note from this portfolio during the quarter. The first is that STORE Capital agreed to be acquired, and the stock was up about 20% on the day of the announcement. The transaction is expected to close during the first quarter of 2023. Within the bond portion of this portfolio, we increased exposure to short-term corporate bonds and exited our exposure to emerging market bonds. We believe the yield on short-term corporate bonds provides an attractive opportunity and that the strong dollar creates a headwind for emerging market economies.
Trading activity during the quarter:
- New positions – United Parcel Service
- Increased position size – iShares 1-5 year investment grade corporate bond ETF, LyondellBasell, and Sanofi
- Exited positions – General Mills and iShares Emerging Market Bond ETF
Tom Searson, CFA
The analysis and performance information contained herein reflects that of portfolios used by Providence Capital Advisors, LLC, a Securities and Exchange Commission Registered Investment Advisor. This information should not be relied upon for tax purposes and is based upon sources believed to be reliable. No guarantee is made to the completeness or accuracy of this information. Providence Capital Advisors, LLC shall not be responsible for any trading decisions, damages, or other losses resulting from, or related to, the information, data, analyses or opinions contained herein or their use, which do not constitute investment advice, are provided as of the date written, are provided solely for informational purposes, and therefore are not an offer to buy or sell a security. This information has not been tailored to suit any individual.
Providence Capital Advisors, LLC does not guarantee the results of its advice or recommendations, or that the objectives of a strategy will be achieved. Portfolios offered by Providence Capital Advisors, LLC may not have contained and/or may not currently contain the same underlying holdings and may have been and/or may currently be managed according to rules or restrictions established by Providence Capital Advisors, LLC. The income numbers for Covered Call and Diversified Income are based on one portfolio in the composite that serves as the model portfolio. Actual income returns may be different for other portfolios. Employees of Providence Capital Advisors, LLC may have holdings in the securities and/or utilize the same portfolio strategies as presented herein.
Benchmark returns are used for comparative purposes only and are not intended to directly parallel the risk or investment style of the accounts included in our investments. The volatility of the indices compared herein may be materially different from that of the compared Providence Capital Advisors, LLC strategy. There is no guarantee that the strategies will outperform, or even match, benchmark returns over the long term.
This commentary contains certain forward-looking statements. Forward-looking statements involve known and unknown risks, uncertainties and other factors which may cause the actual results to differ materially and/or substantially from any future results, performance or achievements expressed or implied by those projected in the forward-looking statements for any reason.
Past performance is not indicative of future results. Therefore, no current or prospective client should assume that future performance of any specific investment or investment strategy (including the investments and/or investment strategies recommended or undertaken by Providence Capital Advisors, LLC) will be profitable or equal the corresponding indicated performance level(s). Different types of investments involve varying degrees of risk, and there can be no assurance that any specific investment will either be suitable or profitable for a client or prospective client’s investment portfolio. Historical performance results for investment indices and/or categories generally do not reflect the deduction of transaction and/or custodial charges, the deduction of an investment management fee, nor the impact of taxes, the payment of which would have the effect of decreasing historical performance results.