
20 Jan Q4 2022
2022 was a year for the record books in financial markets, but unfortunately not in a positive way. Although there were certainly fundamental reasons for the pullback in equity markets, we were also due for a retrenchment. After the financial crisis in 2008, the S&P 500 produced a positive return in 12 of the next 13 calendar years through 2021. 10 of those 13 years were double-digit returns, and 5 of those 13 years had returns over 20%. There were significant bumps in the road during these 13 years (Covid in 2020 being the biggest example), however the annualized return during this period was 16%. Periods of high returns lead to stretched valuations, and markets tend to reset.
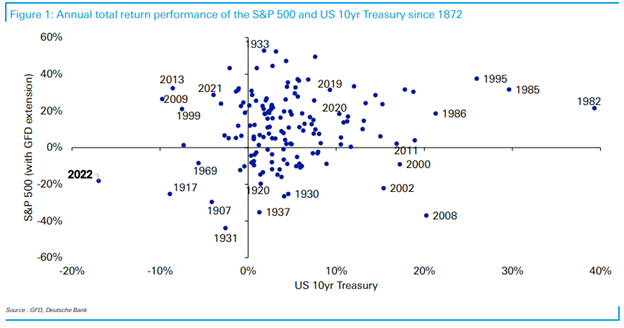
The negative returns in equity markets last year were painful, but they were not unique. Equity markets are volatile and are expected to have down years. The uniqueness of 2022 was primarily concentrated in the bond market. 2022 was the worst year on record for bonds. To make matters worse, 2022 was the first year in history that both the S&P 500 and the 10-year US Treasury lost more than 10% for a full calendar year:
The diversification benefits of owning a balanced portfolio of stocks and bonds broke down during 2022. This breakdown was driven by all-time low interest rates. Ultra-low interest rates inflated stock valuations and skewed the risk/return profile of owning bonds. The significant increase in interest rates during 2022 reset bond yields to a level in which bonds now offer more attractive returns. Balance has been added back to a balanced portfolio, and the historic diversification benefits should be reestablished.
On the equity side of investing, what investors did not own was arguably more important than what they did own during 2022. In February 2021, I wrote about pockets of bubbles in financial markets such as meme stocks, IPOs, SPACs, and Bitcoin. These assets starting trending down in 2021 and continued to crater in 2022. Meme stocks such as GameStop, Blackberry, AMC, and Bed Bath & Beyond were down 50%, 65%, 76%, and 83% respectively in 2022. Furthermore, those four meme stocks were down an average of 88% from their peak stock prices. The Renaissance IPO Index was down 57% in 2022. The SPAC Index is down 50% from its peak. Finally, Bitcoin, which may have been the topic of interesting family discussions over the holidays, was down 64% last year. On a related note, the bankruptcy of cryptocurrency exchange, FTX, is the 4th largest bankruptcy in history. Carnage was not limited to niche areas of the market. Tesla and Meta Platforms (Facebook) were the 5th and 6th largest stocks in the S&P 500 at the beginning of 2022, and both stocks were down about 65% last year. Our focus on investing in high quality companies combined with our disciplined valuation process allowed us to avoid these investment land mines.
Looking forward to 2023, the economy is likely to enter the most expected recession in history. The significant increase in interest rates has begun slowing the economy, and this slowing is highly likely to continue in 2023. One of the key questions for this year is what impact the slowing of growth and inflation will have on the Federal Reserve’s interest rate decisions. Based on what we know now, the Federal Reserve is likely to slow the pace of interest rate increases and then stop increasing rates sometime during the first half of the year. Whether the Fed then cuts interest rates later in the year is dependent upon how severely growth slows and whether inflation trends down quickly towards the Fed’s target. I expect markets to be volatile, especially during the first half of the year, as investors anticipate Federal Reserve responses to incoming growth and inflation data.
Please see below for some commentary on the year and 4th quarter trading activity for each of our portfolios.
Core Equity
The top performing stock in our Core Equity portfolio in 2022 was Schlumberger, which we purchased in late September. Other top performing stocks were AES Corp, Johnson Controls, Booz Allen Hamilton, and Deere. All top five performing stocks for the year were new additions to the portfolio during 2022. The worst performing stocks were Zebra Technologies, Amazon, and Disney.
Trading activity during the quarter:
- Increased position size: Grocery Outlet, Zebra Technologies, Deere, Booz Allen Hamilton, and Disney
- Exited positions: BlackRock
- Decreased position size: AES Corp, Eaton
Covered Call
Our Covered Call portfolio is designed to provide a higher level of income and a lower level of volatility than a typical equity portfolio. Income continued to be strong in 2022 with approximately 7.6% call premium plus approximately 2.0% dividends for an approximate 9.6% total income yield. Income yield over the last seven years has averaged approximately 10.4% and has been within the range of 9.5% to 11.5% each year.
Due to the market pullback in 2022, fewer stocks were called away than during an average year. As options expired, we often rewrote new options with more upside to the strike than a typical trade. This allowed for a higher degree of price appreciation during the 4th quarter when markets rebounded.
Diversified Income
Top performers in our Diversified Income portfolio in 2022 included Valero, Chevron, and Merck. Laggards during the year were Crown Castle and a few of our preferred stock holdings. The goal of the portfolio is to provide a sustainable income stream, and the portfolio generated an approximate income yield of 4.1% for the year. The increase in interest rates provided an opportunity for us to increase the fixed income allocation in this multi-asset class portfolio during 2022.
Trading activity during the 4th quarter:
- New positions: Short-term Treasury EFT
- Increased position size: Crown Castle and Healthcare Realty Trust
- Exited positions: STORE Capital
Bonds
As mentioned earlier, 2022 was a historic year in bond markets. The yield on the 10-year US Treasury increased from 1.51% to 3.88%, the largest one-year increase since 1788. Bond prices and yields move inversely, therefore this increase in yields corresponded to negative returns in bonds. Our bond portfolio has a relatively short average time until maturity, which reduces price volatility during times when interest rates increase. Additionally, by investing in individual bonds and holding bonds until maturity, investors do not realize any price declines and will receive full principal (assuming no default) at maturity. The dramatic increase in interest rates during 2022 results in opportunities in fixed income investments that have not existed for over a decade.
Best wishes for a prosperous 2023!
Tom Searson, CFA
The analysis and performance information contained herein reflects that of portfolios used by Providence Capital Advisors, LLC, a Securities and Exchange Commission Registered Investment Advisor. This information should not be relied upon for tax purposes and is based upon sources believed to be reliable. No guarantee is made to the completeness or accuracy of this information. Providence Capital Advisors, LLC shall not be responsible for any trading decisions, damages, or other losses resulting from, or related to, the information, data, analyses or opinions contained herein or their use, which do not constitute investment advice, are provided as of the date written, are provided solely for informational purposes, and therefore are not an offer to buy or sell a security. This information has not been tailored to suit any individual.
Providence Capital Advisors, LLC does not guarantee the results of its advice or recommendations, or that the objectives of a strategy will be achieved. Portfolios offered by Providence Capital Advisors, LLC may not have contained and/or may not currently contain the same underlying holdings and may have been and/or may currently be managed according to rules or restrictions established by Providence Capital Advisors, LLC. The income numbers for Covered Call and Diversified Income are based on one portfolio in the composite that serves as the model portfolio. Actual income returns may be different for other portfolios. Employees of Providence Capital Advisors, LLC may have holdings in the securities and/or utilize the same portfolio strategies as presented herein.
Benchmark returns are used for comparative purposes only and are not intended to directly parallel the risk or investment style of the accounts included in our investments. The volatility of the indices compared herein may be materially different from that of the compared Providence Capital Advisors, LLC strategy. There is no guarantee that the strategies will outperform, or even match, benchmark returns over the long term.
This commentary contains certain forward-looking statements. Forward-looking statements involve known and unknown risks, uncertainties and other factors which may cause the actual results to differ materially and/or substantially from any future results, performance or achievements expressed or implied by those projected in the forward-looking statements for any reason.
Past performance is not indicative of future results. Therefore, no current or prospective client should assume that future performance of any specific investment or investment strategy (including the investments and/or investment strategies recommended or undertaken by Providence Capital Advisors, LLC) will be profitable or equal the corresponding indicated performance level(s). Different types of investments involve varying degrees of risk, and there can be no assurance that any specific investment will either be suitable or profitable for a client or prospective client’s investment portfolio. Historical performance results for investment indices and/or categories generally do not reflect the deduction of transaction and/or custodial charges, the deduction of an investment management fee, nor the impact of taxes, the payment of which would have the effect of decreasing historical performance results.