
13 Jul Q1 2023
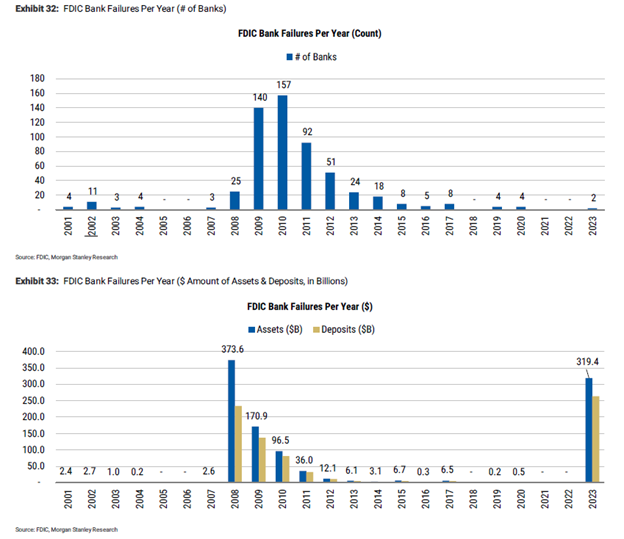
The first quarter of 2023 was notable for the 2nd and 3rd largest bank failures in United States history. On March 10th, Silicon Valley Bank (SIVB) was placed into receivership by the FDIC. This was followed shortly by the same action taken on Signature Bank (SBNY) on March 12th. As you can see in the charts below, two bank failures in a year is not noteworthy, but the size of the banks involved echoes back to the financial crisis. As of the end of 2022, Silicon Valley Bank was the 16th largest bank in the United States and Signature Bank was the 29th largest.
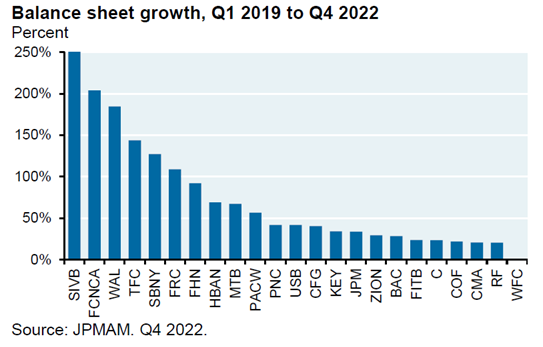
Silicon Valley Bank was founded in 1983 and focused almost exclusively on technology start-up companies and their founders. The number and dollar amount of Initial Public Offerings skyrocketed in 2020 and 2021, which resulted in technology start-up companies and their founding investors being flush with cash, leading to tremendous growth at SIVB:
Banks have three options when customers deposit cash: hold cash, make loans, or buy securities. SIVB’s customers did not need loans – as mentioned previously, they were sitting on huge cash balances. SIVB instead took customer deposits and invested in bonds. The problem is they were buying long-dated bonds at generational-low yields. As of the end of 2022, 80% of SIVB’s securities holdings were bonds that matured in 10 years or greater and the weighted average yield of these bonds was only 1.6%. As discussed on our 4Q22 newsletter, 2022 was the worst year on record for bond returns. Bonds with a long time until maturity, such as the majority of those owned by SIVB, are more sensitive to interest rates, and therefore more susceptible to large price movements.
Activity for new technology companies slowed markedly in 2022, and SIVB customers drew down cash balances to fund operations. In order to meet customer withdrawal requests, SIVB was forced to take action to shore up their balance sheet. The bank sold $21 billion in bonds which resulted in a $1.8 billion loss. They also announced the intent to raise more capital by issuing equity, but panic set in before the equity raise could took place. Investors and depositors sensed distress. Stockholders dumped the stock, and depositors attempted to withdraw $42 billion in deposits in just one day. A classic run on the bank took place.
Depositors’ fear of losing their funds was amplified by another unique quality of SIVB: the bank’s significant percentage of deposits above FDIC insurance. FDIC insurance guarantees $250,000 per depositor per bank. This structure is set up so that depositors feel comfortable leaving their funds in a bank, helping to prevent bank runs. The problem for SIVB is that approximately 90% of deposits were above this threshold.
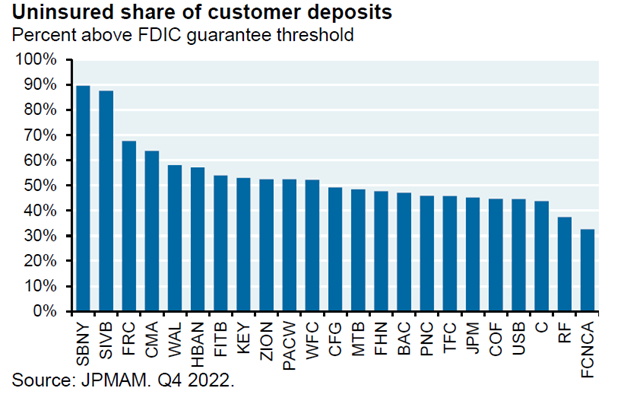
Depositors with balances above $250,000 could not wait around and hope everything would be fine. They pulled funds, or attempted to pull funds, in order to move to safety.
SIVB had many qualities that made its situation unique: huge growth in deposits at a time when interest rates were historically low, concentrated customer base that needed to withdraw funds, significant percentage of assets in long-dated bonds, and vast majority of deposits above the FDIC insurance limit. As mentioned earlier, SBNY failed two days after SIVB. SBNY faced many of the same exact difficulties as SIVB with one notable difference. SBNY had large exposure to crypto currency companies and their customers rather than start-up technology companies.
The US Treasury made two announcements after the failures of SIVB and SBNY to try to stop the flow of capital out of smaller banks. The first announcement was that all deposits at SIVB and SBNY were guaranteed, inclusive of all amounts above the FDIC insurance limit. The second announcement set up a structure for banks to borrow from the Federal Reserve on favorable terms. This would allow banks to borrow to replace the deposits that were heading out the door. Markets have calmed down after the initial bank failure-related turmoil, but there are three important consequences of the demise of SIVB and SBNY.
Over the last thirteen months, the Federal Reserve has increased interest rates at the fastest pace in 40 years. This dramatic shift was bound to cause something to break, and SIVB and SBNY were the first casualties. I think the idiosyncratic qualities of these two banks provides comfort that they are not the first dominos to fall in a series of bank failures, but merely outliers. I do, however, believe other institutions could break due to the massive change in interest rates. It could be another bank, a hedge fund, a player in the private credit arena, or some other corner of the financial markets.
The second consequence of SIVB and SBNY’s demise is that capital will flow out of small and mid-sized banks to the large banks and money market funds. Individuals and companies are likely to keep deposits below the FDIC insurance limit unless they are banking with the largest banks due to the perception of safety at large banks during times of stress. A recent Wall Street Journal article cited data from the Federal Reserve that the 25 biggest U.S. banks gained $120 billion in deposits in the days after the SIVB collapse, while banks below the 25 largest lost $108 billion. Capital will also likely continue flowing to money market funds due to the higher interest rate earned over bank deposits. Banks have not increased interest earned on deposits as interest rates have increased, and customers will hold excess cash outside of bank deposit accounts where they can earn a higher yield.
The last, and in my opinion, most important outcome of these bank failures is that banks are likely to curtail lending. This will be especially true at small and mid-sized banks that have lost deposits. As loans mature, banks will likely decide against renewing some loans, instead they will leave excess capital on their balance sheet for safety. Loan demand will also continue to decrease due to higher borrowing rates. As loan supply and demand both decrease, economic growth will slow. We continue to wait for the most anticipated recession in history, and credit contraction in the banking industry increases the odds that recession predictions come to fruition.
Stock and bond markets both posted positive returns during the first quarter. Please see below for some commentary and trading activity for each of our portfolios.
Core Equity
The top performing stock in our Core Equity portfolio was Nvidia, up an astonishing 90% in the quarter. The launch of ChatGPT has focused attention on Artificial Intelligence and High-Performance Computing. Nvidia is a leader in Graphics Processing Units, which are critical components to growth and development in these areas. Other top performers were Advanced Mirco Devices, Apple, Zebra Technologies, and Amazon. Laggards during the quarter were Pfizer, AES, Bank of America, and Booz Allen Hamilton. Trading activity during the quarter:
- New position: Archer-Daniels-Midland
- Increase position size: Bank of America
- Exited position: F5, Constellation Brands, Electronic Arts, Johnson Controls
- Decrease position size: Zebra Technologies, NXP Semiconductors
Covered Call
On average, five to six options expire each month in our Covered Call portfolio. If the option expires worthless, we typically sell another option on the same stock. If the stock price is above the option strike, and the underlying stock is called away, we typically replace the holding with a new covered call position. Trading activity during the quarter: - New positions during the quarter: CSX, General Motors, Walmart, Applied Materials, Waste Management, Morgan Stanley, Johnson & Johnson
- Option rewrites: Comcast, Cisco Systems, Lowes, Pepsi, Quest Diagnostics, Microsoft, Apple, Citigroup, Kinder Morgan, Disney, Medtronic, Corning
- Positions called away: DuPont, Emerson Electric, Texas Instruments, TJX Companies, State Street
- Positions Sold: Baxter
Diversified Income
Top performing holdings in the Diversified Income portfolio were Broadcom, LyondellBasell, JPMorgan Chase Preferred Series JJ, UPS, and Sanofi. Laggards were Keycorp, Pfizer, US Bancorp, and Prudential. During the quarter, we continued to increase the fixed income allocation of this multi-asset class portfolio.
- New positions: iShares Floating Rate Bond ETF, iShares iBoxx Investment Grade Corporate Bond ETF, Williams Companies
- Exited positions: Merck, Keycorp
- Decreased position size: Sanofi, Broadcom
Tom Searson, CFA
The analysis and performance information contained herein reflects that of portfolios used by Providence Capital Advisors, LLC, a Securities and Exchange Commission Registered Investment Advisor. This information should not be relied upon for tax purposes and is based upon sources believed to be reliable. No guarantee is made to the completeness or accuracy of this information. Providence Capital Advisors, LLC shall not be responsible for any trading decisions, damages, or other losses resulting from, or related to, the information, data, analyses or opinions contained herein or their use, which do not constitute investment advice, are provided as of the date written, are provided solely for informational purposes, and therefore are not an offer to buy or sell a security. This information has not been tailored to suit any individual.
Providence Capital Advisors, LLC does not guarantee the results of its advice or recommendations, or that the objectives of a strategy will be achieved. Portfolios offered by Providence Capital Advisors, LLC may not have contained and/or may not currently contain the same underlying holdings and may have been and/or may currently be managed according to rules or restrictions established by Providence Capital Advisors, LLC. The income numbers for Covered Call and Diversified Income are based on one portfolio in the composite that serves as the model portfolio. Actual income returns may be different for other portfolios. Employees of Providence Capital Advisors, LLC may have holdings in the securities and/or utilize the same portfolio strategies as presented herein.
Benchmark returns are used for comparative purposes only and are not intended to directly parallel the risk or investment style of the accounts included in our investments. The volatility of the indices compared herein may be materially different from that of the compared Providence Capital Advisors, LLC strategy. There is no guarantee that the strategies will outperform, or even match, benchmark returns over the long term.
This commentary contains certain forward-looking statements. Forward-looking statements involve known and unknown risks, uncertainties and other factors which may cause the actual results to differ materially and/or substantially from any future results, performance or achievements expressed or implied by those projected in the forward-looking statements for any reason.
Past performance is not indicative of future results. Therefore, no current or prospective client should assume that future performance of any specific investment or investment strategy (including the investments and/or investment strategies recommended or undertaken by Providence Capital Advisors, LLC) will be profitable or equal the corresponding indicated performance level(s). Different types of investments involve varying degrees of risk, and there can be no assurance that any specific investment will either be suitable or profitable for a client or prospective client’s investment portfolio. Historical performance results for investment indices and/or categories generally do not reflect the deduction of transaction and/or custodial charges, the deduction of an investment management fee, nor the impact of taxes, the payment of which would have the effect of decreasing historical performance results.