
13 Jul Q2 2023
The market frenzy around artificial intelligence continued in the second quarter. Intense focus on artificial intelligence began last November with the launch of ChatGPT. Market attention switched to the regional bank crisis in March with the failures of Silicon Valley Bank, Signature Bank, and eventually First Republic Bank, but it did not take long for the focus to shift back to AI. On May 24th Nvidia, the company that designs and develops semiconductors needed for AI, reported earnings. On this earnings call the company projected revenues of $11 billion in the upcoming quarter in comparison to expectations of $7 billion. The company referred to the current increase in AI awareness and the ensuing computing arms race as its, “iPhone moment”, and the stock was up 24% the next day. This one-day change in stock price added $184 billion in market capitalization to Nvidia, larger than the full value of companies such as Nike, Lowe’s, Intel, Verizon, and Disney. The AI frenzy was back.
Artificial intelligence is a broad term used to describe machines that mimic human intelligence. ChatGPT is a large language model, which is a subcategory of artificial intelligence in which computers are trained on large amounts of data and are able to generate output in response to human questions. There are countless AI topics that can and should be debated, but from an economic standpoint the key benefit is productivity. Goldman Sachs economist Joseph Briggs estimates that artificial intelligence could raise labor productivity by 1.5 percentage points over a 10-year period, which would increase annual global GDP by 7%, equating to almost $7 trillion.
The market’s focus on AI resulted in a small number of companies driving returns for the entire market. The 7 largest companies in the S&P 500 are now all mega-cap tech stocks: Apple, Microsoft, Alphabet (Google), Amazon, Nvidia, Tesla, and Meta (Facebook). The average return for these 7 stocks during the first half of the year was 89%. The average return for the other 493 companies in the S&P 500 was 6%. Casting the net slightly wider, these 7 companies are included in 3 sectors: Technology (Apple, Microsoft, and Nvidia), Communication Services (Alphabet and Meta), and Consumer Discretionary (Amazon and Tesla). These 3 sectors generated 96% of the return of the S&P 500 during the first half of the year. The return of the other 8 sectors was essentially a rounding error. One final statistic about these stocks is that the first half of 2023 was the highest return in the first half of a year for the NASDAQ (index primarily focused on tech stocks) since 1983. It was truly an astounding 6 months.
Outsized returns for a small number of the largest companies resulted in the weight of the top 10 stocks in the S&P 500 rising to the highest level in recent history, and the valuation multiples of these stocks stretched in comparison to both history and the rest of the market:
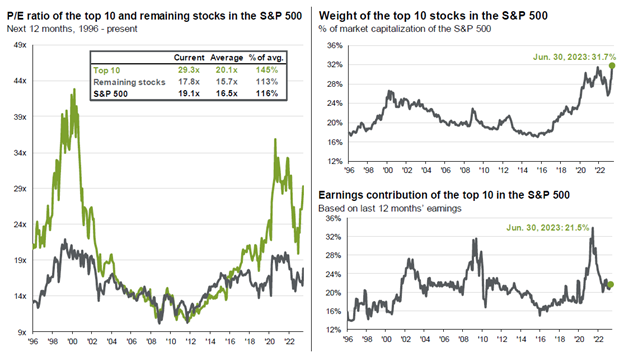
Source: JPMorgan Asset Management
The key to navigating an investment landscape focused on one driver is balance. AI is likely to have a profound impact on the global economy, but the road will be bumpy. Previous technology-led productivity booms such as PCs in the 1980s and internet in the late 1990s did not immediately improve productivity. It takes time for businesses and consumers to work through how to harness and take advantage of technology improvements. During these phases, valuations of companies involved can become too stretched as expectations of future growth become too high. Balancing the right companies to own and the size of the positions in the portfolio against stock valuations and future expectations is a delicate tightrope to traverse. Emotion often plays a larger role in these environments where exuberance and fear of missing out abound. Applying a discerning lens to stock market darlings while identifying value play key roles in long-term investment success.
Outside of AI, one data point to keep an eye on is excess savings. Households increased savings during Covid as a result of historic levels of government transfers combined with lower spending due to social distancing. A recent paper by the Federal Reserve Bank of San Francisco estimated that excess savings totaled approximately $2.1 trillion at its peak in August 2021. Since that time roughly $1.6 trillion has been spent, resulting in an estimated $500 billion remaining.
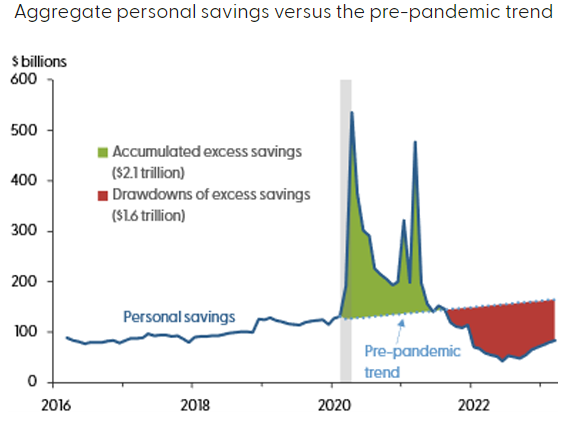
Source: Federal Reserve Bank of San Francisco
The Federal Reserve Bank of San Francisco estimates that remaining excess savings will be fully extinguished around the end of this year. Consumer spending of excess savings has fueled both inflation and growth over the last couple years. As excess savings recedes, demand should slow, putting downward pressure on growth and inflation.
Please see below for some commentary and trading activity for each of our portfolios.
Core Equity
The top performing stock during the quarter was Nvidia, which should not be surprising based on the AI commentary earlier. Other top performing stocks included Amazon, Booz Allen Hamilton, and Microsoft. Laggards during the quarter were Ciena and AES Corp. We placed one trade during the quarter, initiating a new position in IQVIA. IQVIA is a technology consulting and contract research company that serves the Health Sciences industry. We believe the company’s industry-leading data resources will be a catalyst for continued growth. The overall market was resilient during the quarter, with the largest pullback only about 2.5%. We increased cash during the first quarter and will continue to look for opportunities to put this cash to work. We believe volatility in the back half the year could provide better opportunities.
Covered Call
On average, five to six options expire each month in our Covered Call portfolio. If the option expires worthless, we typically sell another option on the same stock. If the stock price is above the option strike, and the underlying stock is called away, we typically replace the holding with a new covered call position. Trading activity during the quarter:
- New positions during the quarter: Sysco, Cisco Systems, Dow, Texas Instruments, Danaher, Dell, Johnson Controls
- Option rewrites: Applied Materials, Comcast, Lowe’s, CSX, Quest Diagnostics, Morgan Stanley, General Motors, Citigroup, Corning
- Positions called away: Cisco Systems, PepsiCo, Walmart, Apple, Waste Management, Medtronic, Johnson & Johnson, Microsoft
Diversified Income
Top performing holdings in the Diversified Income portfolio were Broadcom, Whirlpool, and Williams Companies. Laggards included AT&T, AbbVie, and Crown Castle. Trading activity during the quarter:
- Increased position size: US Bancorp, iShares iBoxx Investment Grade Corporate Bond ETF
- Exited positions: Broadcom
Tom Searson, CFA
The analysis and performance information contained herein reflects that of portfolios used by Providence Capital Advisors, LLC, a Securities and Exchange Commission Registered Investment Advisor. This information should not be relied upon for tax purposes and is based upon sources believed to be reliable. No guarantee is made to the completeness or accuracy of this information. Providence Capital Advisors, LLC shall not be responsible for any trading decisions, damages, or other losses resulting from, or related to, the information, data, analyses or opinions contained herein or their use, which do not constitute investment advice, are provided as of the date written, are provided solely for informational purposes, and therefore are not an offer to buy or sell a security. This information has not been tailored to suit any individual.
Providence Capital Advisors, LLC does not guarantee the results of its advice or recommendations, or that the objectives of a strategy will be achieved. Portfolios offered by Providence Capital Advisors, LLC may not have contained and/or may not currently contain the same underlying holdings and may have been and/or may currently be managed according to rules or restrictions established by Providence Capital Advisors, LLC. The income numbers for Covered Call and Diversified Income are based on one portfolio in the composite that serves as the model portfolio. Actual income returns may be different for other portfolios. Employees of Providence Capital Advisors, LLC may have holdings in the securities and/or utilize the same portfolio strategies as presented herein.
Benchmark returns are used for comparative purposes only and are not intended to directly parallel the risk or investment style of the accounts included in our investments. The volatility of the indices compared herein may be materially different from that of the compared Providence Capital Advisors, LLC strategy. There is no guarantee that the strategies will outperform, or even match, benchmark returns over the long term.
This commentary contains certain forward-looking statements. Forward-looking statements involve known and unknown risks, uncertainties and other factors which may cause the actual results to differ materially and/or substantially from any future results, performance or achievements expressed or implied by those projected in the forward-looking statements for any reason.
Past performance is not indicative of future results. Therefore, no current or prospective client should assume that future performance of any specific investment or investment strategy (including the investments and/or investment strategies recommended or undertaken by Providence Capital Advisors, LLC) will be profitable or equal the corresponding indicated performance level(s). Different types of investments involve varying degrees of risk, and there can be no assurance that any specific investment will either be suitable or profitable for a client or prospective client’s investment portfolio. Historical performance results for investment indices and/or categories generally do not reflect the deduction of transaction and/or custodial charges, the deduction of an investment management fee, nor the impact of taxes, the payment of which would have the effect of decreasing historical performance results.