
20 Nov Q3 2023
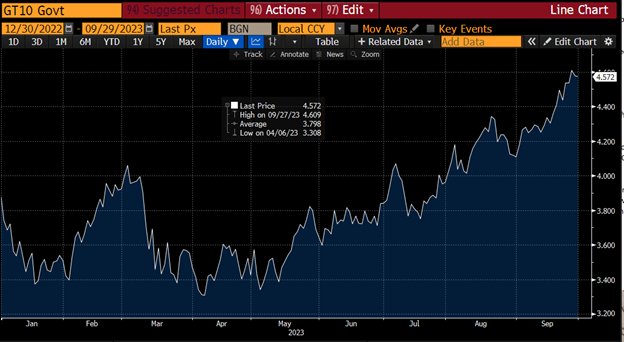
Interest rates were the key theme in economies and markets last quarter. The 10 Year US Treasury rate increased from 3.8% on June 30th to 4.6% on September 30th, and continued its upward momentum to 4.8% on October 6th, which is the highest level since 2007. The Federal Reserve lifted the Fed Funds rate by 0.25% in July to the highest rate since 2000, and indicated that they intend to keep the Fed Funds rate higher for longer. Federal reserve commentary and continued labor market momentum drove the US 10 year rate up by almost 100 basis points in the quarter.
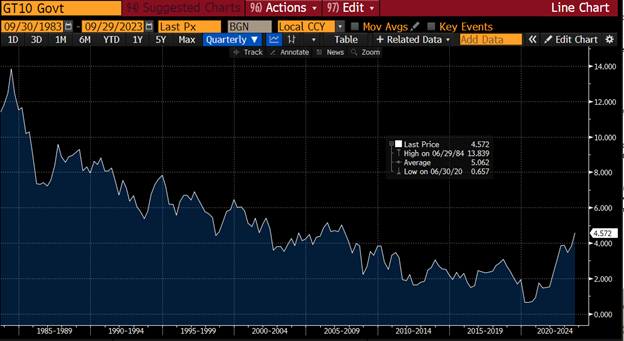
The charts below help depict the magnitude of changes in interest rates. The first chart is a 40 year chart showing that the long-term downward trend was broken in 2020 and shifted back to levels not seen in over 15 years.
The next chart is a chart for the first 9 months of 2023. The US 10 year rate bounced between 3.4% and 4.0% for the first 6 months of the year before moving sharply upward during the third quarter.
After a historic rise in interest rates last year, the continued increase is starting to cause problems for highly indebted households and corporations.
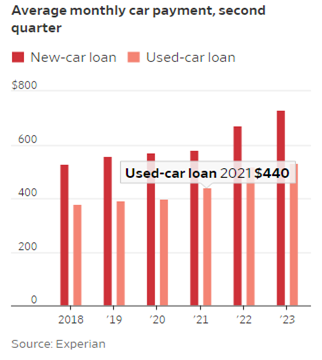
The 30 year fixed mortgage rate has jumped to almost 8% from 3% just two years ago. High mortgage rates combined with high property values led to the National Association of Realtors calculating that the typical American family can’t afford to buy a median-priced home. Auto loan rates have also increased, driving up monthly payments for families:
Credit card rates may be the most punitive. According to the American Bankers Association, in the third quarter of 2022 56% of active credit card accounts carried a balance at some point. Average interest rates on credit card balances increased from an already high 14.5% last year to over 21% this year. The rapid rise in interest rates clearly has an impact on household finances.
In addition, federal student loan payments that had been frozen since March 2020 resume this month. The average payment is $200 – $300 per month, which equates to a 5% pay cut to the median household.
Shifting the discussion to corporations, the increase in interest rates also causes problems for highly indebted companies. Many corporations took advantage of the low rate environment a few years ago to borrow cheaply, however US companies are about to hit a “refinancing wall”. Morgan Stanley estimates that $2.6 trillion in corporate debt will come due between 2023 and 2025. Refinancing drives up interest costs for companies, thereby driving down profitability. As a result, companies are likely to cut back on capital expenditures and hiring. In fact, according to a recent survey of CFOs, 41% have already pulled back on capital spending and 42% have cut costs in other areas such as travel and advertising. Respondents to the CFO survey indicated that after several quarters of the labor market occupying their top concern, the primary concern is now interest rates.
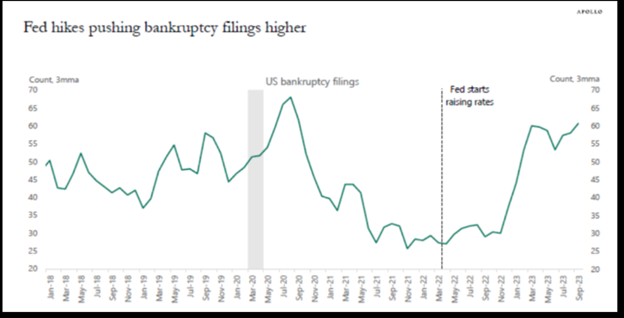
One of Warren Buffett’s most famous quotes is, “Only when the tide goes out do you learn who has been swimming naked.” The significant increase in interest rates certainly has caused the tide to begin receding. According to The Wall Street Journal, large corporate bankruptcies tripled in the first half of this year compared to last year, headlined by Silicon Valley Bank, Bed Bath & Beyond, and the trucking company Yellow. A separate study by economist Torsten Slok at Apollo shows a significant uptick in bankruptcies, particularly hitting firms with high levels of debt and low earnings:
The uptick in corporate bankruptcies does not necessarily signal the beginning of a further surge in bankruptcies, rather it highlights what high interest rates, slow growth, and lingering inflation can do to weak balance sheets.
The key to navigating difficult times is to focus on quality. Companies with strong balance sheets, low debt, and high cash flows can be opportunistic while competitors with a weaker financial profile focus on survival. A focus on quality permeates all of our investment portfolios, and is critical during times like this. The current environment also offers opportunities in high-quality bonds that have not existed for over 15 years. This is a welcome change for bond investors after a long period of low yields in bonds.
Please see below for commentary and trading activity for our portfolios.
Core Equity
The top performing stock during the 3rd quarter was SLB, as a 28% increase in oil prices led to the energy sector being the top performing sector. Other top performing stocks included Ciena, Alphabet, and Eaton. Laggards during the quarter were AES, Zebra Technologies, and Xylem. Hershey is the one new company added to the portfolio during the quarter. We believe the pullback in stock price and valuation provides a solid entry point into a market leader. This investment also aligns with our market views discussed in this newsletter.
- New positions: Hershey
- Increase position size: Abbott Labs, Roche
- Exited positions: Pfizer
- Decrease position size: Nvidia, Advanced Micro Devices, Eaton
Covered Call
On average, five to six options expire each month in our Covered Call portfolio. If the option expires worthless, we typically sell another option on the same stock. If the stock price is above the option strike, and the underlying stock is called away, we typically replace the holding with a new covered call position. Trading activity during the quarter:
- New positions during the quarter: Qualcomm, Target, Oracle, Medtronic, Lowe’s, Abbott Labs
- Option rewrites: Kinder Morgan, Dow, Disney, CSX, Quest Diagnostics, Sysco, GM, Morgan Stanley, Texas Instruments, Citigroup, Corning
- Positions called away: Cisco Systems, Applied Materials, Comcast, Lowe’s, Danaher
Diversified Income
Top performing holdings in the Diversified Income portfolio were Abbvie, Prudential, Chevron, and Old Republic. Laggards during the quarter were Crown Castle, Healthcare Realty Trust, BCE, and Telus. Trading activity during the quarter
- New positions during the quarter: General Mills
- Increased position size: Pfizer
Tom Searson, CFA
The analysis and performance information contained herein reflects that of portfolios used by Providence Capital Advisors, LLC, a Securities and Exchange Commission Registered Investment Advisor. This information should not be relied upon for tax purposes and is based upon sources believed to be reliable. No guarantee is made to the completeness or accuracy of this information. Providence Capital Advisors, LLC shall not be responsible for any trading decisions, damages, or other losses resulting from, or related to, the information, data, analyses or opinions contained herein or their use, which do not constitute investment advice, are provided as of the date written, are provided solely for informational purposes, and therefore are not an offer to buy or sell a security. This information has not been tailored to suit any individual.
Providence Capital Advisors, LLC does not guarantee the results of its advice or recommendations, or that the objectives of a strategy will be achieved. Portfolios offered by Providence Capital Advisors, LLC may not have contained and/or may not currently contain the same underlying holdings and may have been and/or may currently be managed according to rules or restrictions established by Providence Capital Advisors, LLC. The income numbers for Covered Call and Diversified Income are based on one portfolio in the composite that serves as the model portfolio. Actual income returns may be different for other portfolios. Employees of Providence Capital Advisors, LLC may have holdings in the securities and/or utilize the same portfolio strategies as presented herein.
Benchmark returns are used for comparative purposes only and are not intended to directly parallel the risk or investment style of the accounts included in our investments. The volatility of the indices compared herein may be materially different from that of the compared Providence Capital Advisors, LLC strategy. There is no guarantee that the strategies will outperform, or even match, benchmark returns over the long term.
This commentary contains certain forward-looking statements. Forward-looking statements involve known and unknown risks, uncertainties and other factors which may cause the actual results to differ materially and/or substantially from any future results, performance or achievements expressed or implied by those projected in the forward-looking statements for any reason.
Past performance is not indicative of future results. Therefore, no current or prospective client should assume that future performance of any specific investment or investment strategy (including the investments and/or investment strategies recommended or undertaken by Providence Capital Advisors, LLC) will be profitable or equal the corresponding indicated performance level(s). Different types of investments involve varying degrees of risk, and there can be no assurance that any specific investment will either be suitable or profitable for a client or prospective client’s investment portfolio. Historical performance results for investment indices and/or categories generally do not reflect the deduction of transaction and/or custodial charges, the deduction of an investment management fee, nor the impact of taxes, the payment of which would have the effect of decreasing historical performance results.