
23 Jan Q4 2023
The most notable events in financial markets during 2023 were the significant bank failures early in the year, the market exuberance around artificial intelligence that led to outsized growth at mega-cap tech companies, and the significant change in interest rates. Looking back at our newsletter from the year, those are the topics we covered during the first three quarters. For our fourth quarter newsletter, I thought it would be best to share updates on those three topics and some preliminary thoughts on 2024.
During March we experienced the 2nd and 3rd largest bank failures in United States history when Silicon Valley Bank and Signature Bank collapsed. First Republic failed on
May 1st, surpassing Silicon Valley Bank to be the new 2nd largest bank failure in US history. These three banks proved to be outliers rather than canaries in the coal mine, and no other significant failures followed. Decreasing interest rates late in the year diverted investors’ focus away from banks that own long-dated bonds, which was a key issue with the failed banks. The largest banks benefitted from the turmoil as capital flowed towards safety. Large cap banks posted positive returns on the year, while most regional banks had negative returns.
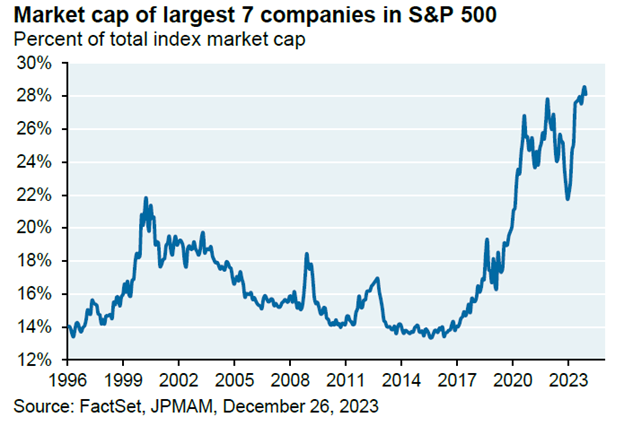
The artificial intelligence frenzy continued throughout the year and gave birth to the moniker, “Magnificent Seven”, for the largest seven companies in the S&P 500: Microsoft, Apple, Alphabet (Google), Amazon, Nvidia, Meta Platforms (Facebook), and Tesla. These seven companies were responsible for 60% of the return of the entire index, while the other 493 companies made up the other 40%. This results in a historically large concentration in equity markets not seen since the dot.com bubble:
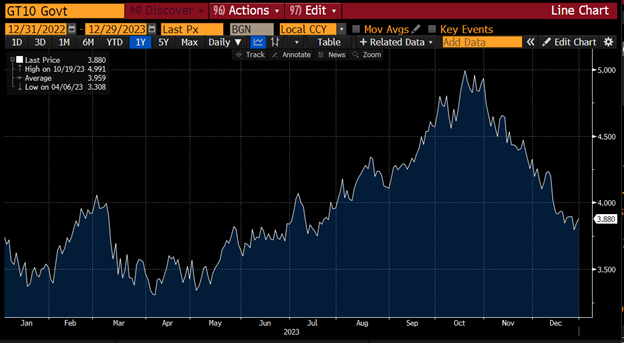
Interest rates made a dramatic reversal during the 4th quarter. The US 10 Year Treasury yield started the year at 3.7% and increased to 5.0% in mid-October before turning downward to 3.9% over the last 10 weeks of the year.
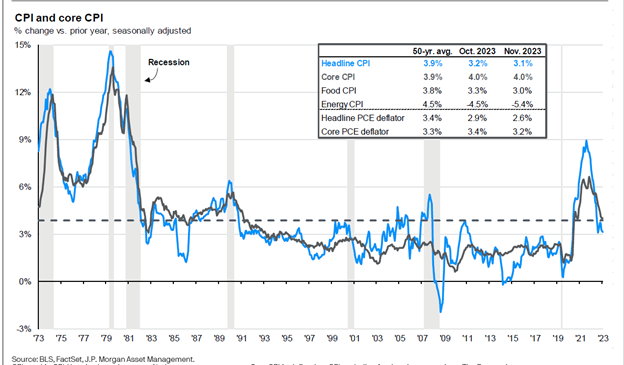
This reversal sparked a rally in equity markets, and stocks had very strong returns in November and December. The interest rate reversal was triggered by the Federal Reserve signaling that their most recent Fed Funds rate increase in July likely would be their last. Investors began expecting rate cuts in 2024, which increases the chances of a “soft landing” in the economy. The Fed’s comfort level with decreasing inflation allowed them to signal the end of rate hikes. After peaking at 9.1% in June 2022, the Consumer Price Index has steadily decreased and ended the year at 3.4%. This level of inflation is still above the Fed’s 2% target, however it appears we will continue trending closer to the Fed’s target level.
2024 should be an interesting year, one likely marked by a tug of push and pull. The market is expecting several rate cuts from the Federal Reserve as inflation continues to soften. I think the most likely outcome is that rate cuts come later in the year, but the Fed keeps rates steady in the first half of the year longer than the markets expect. It will be a delicate tightrope of keeping rates high to tamp down inflation without keeping them too high for too long and thereby increasing recession risk.
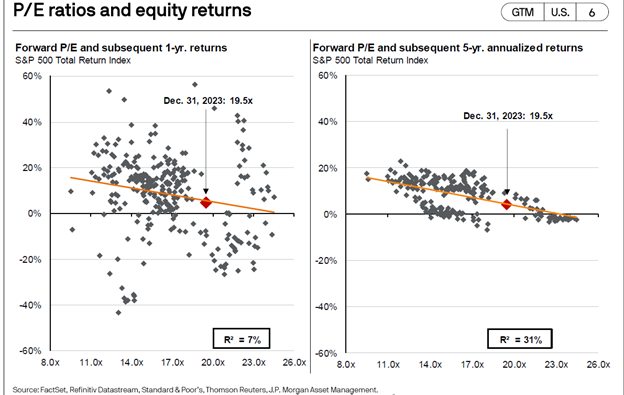
The stock market ended 2023 at a forward price to earnings valuation of 19.5x. This level is about 1 standard deviation above the 30-year average of 16.6x, so the market is expensive, but arguably not overly stretched. I found the following charts interesting. Current valuation does a very poor job of predicting returns over the next 12 months, but a better job of predicting returns over the next 5 years. Based on this data, a mid-single digit annual return over the next five years is the most reasonable expectation for stock market returns.
Please see below for commentary on our investment portfolios and a summary of trading activity for the year.
Core Equity
The top performing stocks in the portfolio during the year were all beneficiaries of investment in artificial intelligence, led by semiconductor companies Nvidia and AMD. Amazon, Alphabet (Google), Microsoft, and Eaton were other top performers. The worst performing stocks were Pfizer and AES. We only executed one trade during the quarter: in early October we increased our investment in AES. AES is a global utility and power producer, and a leader in renewable energy development. The stock performed poorly during the first nine months of the year, as the significant increase in interest rates created concerns about the future financing of renewable developments. We felt the selloff was overdone, and the stock price provided an opportunistic time to add to our investment.
- New positions: Archer Daniels Midland, IQVIA, Hershey
- Increase position size: Brookfield, Bank of America, Abbott Labs, Roche, AES
- Exited positions: F5, Constellation Brands, Electronic Arts, Johnson Controls, Pfizer
- Decrease position size: Zebra Technologies, NXP Semiconductors, Nvidia, Advanced Micro Devices, Eaton
Covered Call
Our Covered Call portfolio is designed to provide a higher level of income and a lower level of volatility than a typical equity portfolio. Income continued to be strong in 2023 with approximately 9.0% call premium plus approximately 3.0% dividends for an approximate 12.0% total income yield. Income yield over the last eight years has averaged approximately 10.6% and has been within the range of 9.5% to 12.0% each year..
Diversified Income
Top performers in our Diversified Income portfolio in 2023 included Broadcom, Old Republic, and Williams. Laggards included Pfizer, KeyCorp, and Dominion Energy. The goal of the portfolio is to provide a sustainable income stream, and the portfolio generated an approximate income yield of 5.0% for the year. We began increasing the fixed income allocation of this portfolio during 2022 when interest rates started to increase. The shift continued during 2023, and fixed income now represents roughly 14% of the portfolio. During the quarter we sold Healthcare Realty Trust and Dominion Energy, and invested the proceeds in Southern Company and increased our investment in American Electric Power. We also swapped a Truist preferred stock holding for a Morgan Stanley preferred stock holding.
Recap of trading activity for the full year:
- New positions: iShares Floating Rate Bond EFT, iShares Investment Grade Corporate Bond EFT, Williams Companies, General Mills, Southern Company, Morgan Stanley preferred stock Series C
- Increased position size: US Bancorp, iShares Investment Grade Corporate Bond EFT, Pfizer, America Electric Power
- Exited positions: Merck, KeyCorp, Broadcom, Healthcare Realty Trust, Dominion Energy, Truist preferred stock Series R
- Decreased position size: Sanofi, Broadcom
Bonds
After the worst year in bond market history during 2022, the bond market provided solid returns in 2023. Our portfolio continues to focus on high-quality individual bonds with very low default risk. We ended 2023 with the portfolio yielding about 4.9% and an average years to maturity between four and five years.
Tom Searson, CFA
The analysis and performance information contained herein reflects that of portfolios used by Providence Capital Advisors, LLC, a Securities and Exchange Commission Registered Investment Advisor. This information should not be relied upon for tax purposes and is based upon sources believed to be reliable. No guarantee is made to the completeness or accuracy of this information. Providence Capital Advisors, LLC shall not be responsible for any trading decisions, damages, or other losses resulting from, or related to, the information, data, analyses or opinions contained herein or their use, which do not constitute investment advice, are provided as of the date written, are provided solely for informational purposes, and therefore are not an offer to buy or sell a security. This information has not been tailored to suit any individual.
Providence Capital Advisors, LLC does not guarantee the results of its advice or recommendations, or that the objectives of a strategy will be achieved. Portfolios offered by Providence Capital Advisors, LLC may not have contained and/or may not currently contain the same underlying holdings and may have been and/or may currently be managed according to rules or restrictions established by Providence Capital Advisors, LLC. The income numbers for Covered Call and Diversified Income are based on one portfolio in the composite that serves as the model portfolio. Actual income returns may be different for other portfolios. Employees of Providence Capital Advisors, LLC may have holdings in the securities and/or utilize the same portfolio strategies as presented herein.
Benchmark returns are used for comparative purposes only and are not intended to directly parallel the risk or investment style of the accounts included in our investments. The volatility of the indices compared herein may be materially different from that of the compared Providence Capital Advisors, LLC strategy. There is no guarantee that the strategies will outperform, or even match, benchmark returns over the long term.
This commentary contains certain forward-looking statements. Forward-looking statements involve known and unknown risks, uncertainties and other factors which may cause the actual results to differ materially and/or substantially from any future results, performance or achievements expressed or implied by those projected in the forward-looking statements for any reason.
Past performance is not indicative of future results. Therefore, no current or prospective client should assume that future performance of any specific investment or investment strategy (including the investments and/or investment strategies recommended or undertaken by Providence Capital Advisors, LLC) will be profitable or equal the corresponding indicated performance level(s). Different types of investments involve varying degrees of risk, and there can be no assurance that any specific investment will either be suitable or profitable for a client or prospective client’s investment portfolio. Historical performance results for investment indices and/or categories generally do not reflect the deduction of transaction and/or custodial charges, the deduction of an investment management fee, nor the impact of taxes, the payment of which would have the effect of decreasing historical performance results.