
16 Apr Q1 2024
The main stories in financial markets during the first quarter were the stickiness of inflation and continued strong economic momentum. The rate of inflation had been on a downward trend since peaking in 2022, but this deceleration stalled during the first 3 months of 2024.
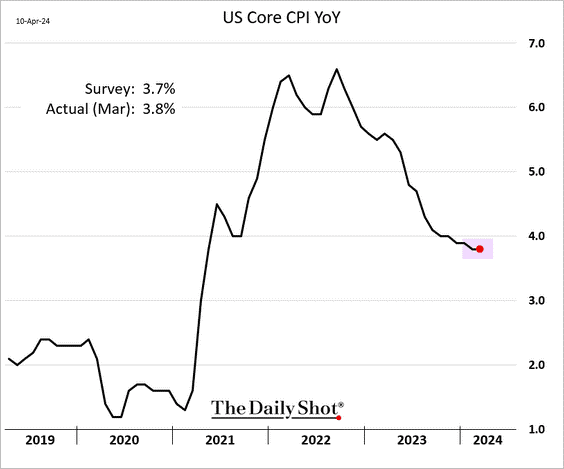
Core Consumer Price Index readings in January, February, and March of 3.9%, 3.8%, and 3.8% all exceeded consensus expectations. The price of goods has been decreasing for several months, but increasing costs of services continues to outpace goods deflation.
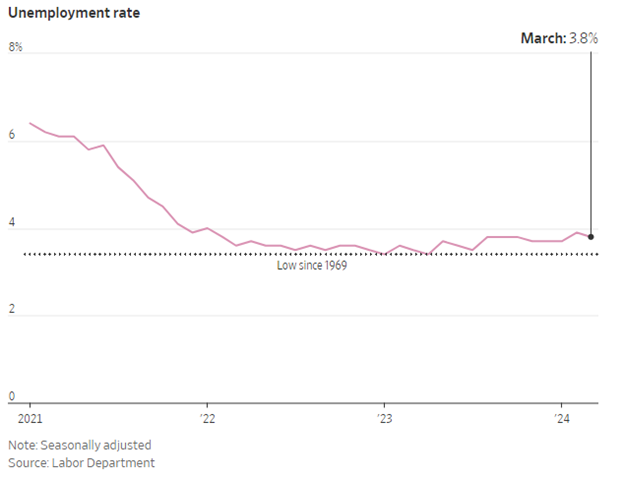
Underpinning stubborn services inflation is a resilient labor market despite higher interest rates. The U.S. economy added 256k, 270k, and 303k jobs in the first 3 months of the year. Just like the inflation readings, all 3 data points exceeded expectations. In conjunction with this job creation, the unemployment rate of 3.8% continues to bump along the lowest rate of the last 50+ years:
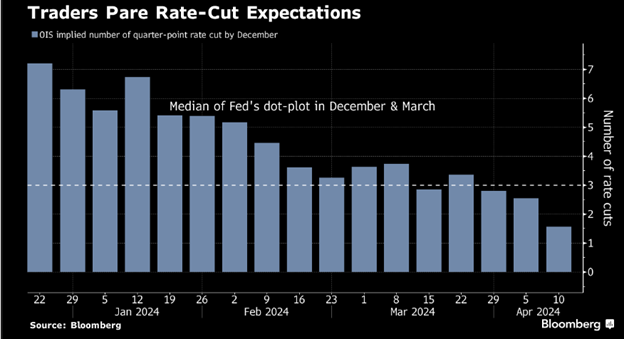
The Federal Reserve began increasing the Federal Funds Rate in early 2022, increasing it by 5.25% over 16 months before pausing in July 2023. Stock markets rallied during the 4th quarter of 2023 on the belief that the Fed was not only finished raising rates, they would begin cutting rates in 2024. Market expectations at the beginning of 2024 were for a 1.5% – 1.75% decrease in the Fed Funds rate during the year, with most investors expecting the process to begin in March. Our house view at the time was that the Fed would start later and cut less than market expectations, but the strong inflation and jobs data have pushed out expectations even further than our thinking a few months ago. The chart below shows the number of expected 0.25% rate cuts during 2024 decreasing from 7 less than 3 months ago down to 1 or 2 cuts. The expected timing of these cuts has been pushed back to the fall, with many investors focused on November and December.
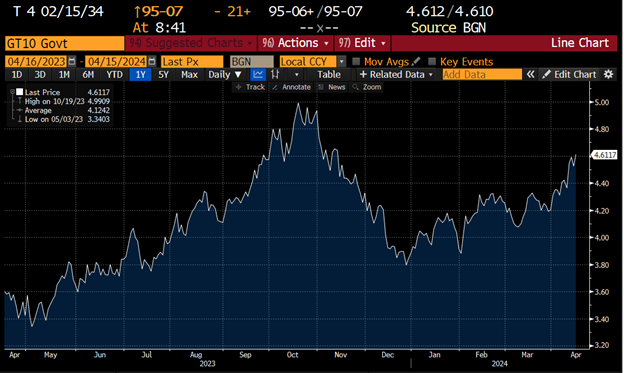
The bond market has responded as one would expect with rates increasing. The rate on the US 10 Year Treasury Bond has increased from 3.8% at the beginning of the year to over 4.6%. It is inching closer to the 17-year high of 5% reached in October of last year.
Stock markets performed surprisingly well during the first quarter, as the strong economic momentum proved more important than rising rates. We expected to see volatility in stock markets during the first half of the year as expectations for interest rate cuts decreased. We still think we could see this volatility over the next couple of quarters as the Fed fights the last mile of its battle with inflation.
Please see below for commentary on our investment portfolios and a summary of trading activity for the year.
Core Equity
For the second quarter in a row, Nvidia was the top performing stock in the portfolio. The company is the top beneficiary of investment in artificial intelligence, and continues to exceed expectations. Other top performers during the first quarter included Disney, Eaton, and AMD. Laggards during the quarter were Archer-Daniels-Midland, Aptiv, and Apple. We initiated 2 new positions in the portfolio during the quarter: Adobe and Lonza. We believe Adobe is well positioned to benefit from generative artificial intelligence in their software offerings. Lonza manufactures for the life sciences industry, and we believe they will benefit from the pharmaceutical industry’s shift from small molecule to biologics. Trading activity during the quarter:
- New positions: Adobe, Lonza
- Increase position size: Hershey, Aptiv
- Exited positions: Archer-Daniels-Midland
- Decrease position size: AMD (3x), Nvidia (2x)
Covered Call
On average, five to six options expire each month in our Covered Call portfolio. If the option expires worthless, we typically sell another option on the same stock. If the stock price is above the option strike, and the underlying stock is called away, we typically replace the holding with a new covered call position. Trading activity during the quarter:
- New positions: MetLife, Comcast, Starbucks, Morgan Stanley, Exxon Mobil, Cisco Systems, Johnson & Johnson, Honeywell, NetApp, Electronic Arts, Nike
- Option rewrites: Oracle, Johnson Controls, Quest Diagnostics, Corning, Texas Instruments, MetLife
- Positions called away: Abbott Labs, Qualcomm, Lowe’s, Kinder Morgan, Dow, Apple, Sysco, Medtronic, CSX, Disney, General Motors, Target
Diversified Income
Top performing positions during the quarter included AbbVie, IBM, Prudential, Williams, and Verizon. Laggards included BCE, Crown Castle, and UPS. Trading activity during the quarter:
- New positions: iShares 20+ Year Treasury Bond ETF
- Increased position size: Bristol-Myers Squibb, Whirlpool, AT&T, Verizon, UPS, Pfizer, iShares Investment Grade Corporate Bond ETF
- Exited positions: iShares Floating Rate Bond ETF, Telus, BCE
- Decreased position size: IBM
Tom Searson, CFA
The analysis and performance information contained herein reflects that of portfolios used by Providence Capital Advisors, LLC, a Securities and Exchange Commission Registered Investment Advisor. This information should not be relied upon for tax purposes and is based upon sources believed to be reliable. No guarantee is made to the completeness or accuracy of this information. Providence Capital Advisors, LLC shall not be responsible for any trading decisions, damages, or other losses resulting from, or related to, the information, data, analyses or opinions contained herein or their use, which do not constitute investment advice, are provided as of the date written, are provided solely for informational purposes, and therefore are not an offer to buy or sell a security. This information has not been tailored to suit any individual.
Providence Capital Advisors, LLC does not guarantee the results of its advice or recommendations, or that the objectives of a strategy will be achieved. Portfolios offered by Providence Capital Advisors, LLC may not have contained and/or may not currently contain the same underlying holdings and may have been and/or may currently be managed according to rules or restrictions established by Providence Capital Advisors, LLC. The income numbers for Covered Call and Diversified Income are based on one portfolio in the composite that serves as the model portfolio. Actual income returns may be different for other portfolios. Employees of Providence Capital Advisors, LLC may have holdings in the securities and/or utilize the same portfolio strategies as presented herein.
Benchmark returns are used for comparative purposes only and are not intended to directly parallel the risk or investment style of the accounts included in our investments. The volatility of the indices compared herein may be materially different from that of the compared Providence Capital Advisors, LLC strategy. There is no guarantee that the strategies will outperform, or even match, benchmark returns over the long term.
This commentary contains certain forward-looking statements. Forward-looking statements involve known and unknown risks, uncertainties and other factors which may cause the actual results to differ materially and/or substantially from any future results, performance or achievements expressed or implied by those projected in the forward-looking statements for any reason.
Past performance is not indicative of future results. Therefore, no current or prospective client should assume that future performance of any specific investment or investment strategy (including the investments and/or investment strategies recommended or undertaken by Providence Capital Advisors, LLC) will be profitable or equal the corresponding indicated performance level(s). Different types of investments involve varying degrees of risk, and there can be no assurance that any specific investment will either be suitable or profitable for a client or prospective client’s investment portfolio. Historical performance results for investment indices and/or categories generally do not reflect the deduction of transaction and/or custodial charges, the deduction of an investment management fee, nor the impact of taxes, the payment of which would have the effect of decreasing historical performance results.