
27 Jan Q4 2024
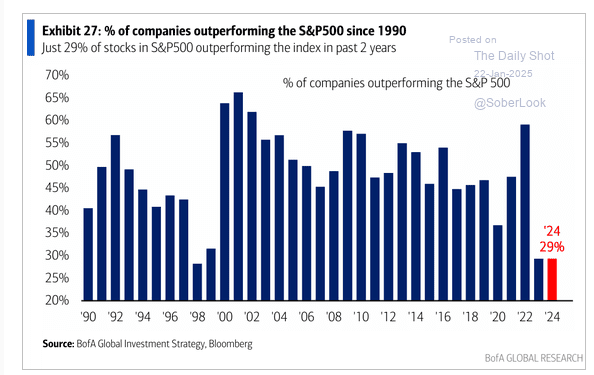
Equity markets in 2024 were nearly a carbon copy of 2023. For the second year in a row, strong market returns were driven by a small number of mega-cap technology companies known as the Magnificent 7. These 7 stocks returned 67% in 2024 after a 107% return in 2023, and in both years were responsible for about 60% of the return of the S&P 500. For the second consecutive year only 29% of the stocks in the S&P 500 returned higher than the index return. As shown in the chart below, market breadth has been extremely narrow the last two years.
As we look into 2025 and beyond, I think balance will become a more critical component to investment portfolios. It is impossible to predict an exact turning point, but the largest stocks cannot continue to outpace the rest of the market in perpetuity. The chart below shows the dramatic divergence in size of the largest 10 stocks vs. the next largest 40.
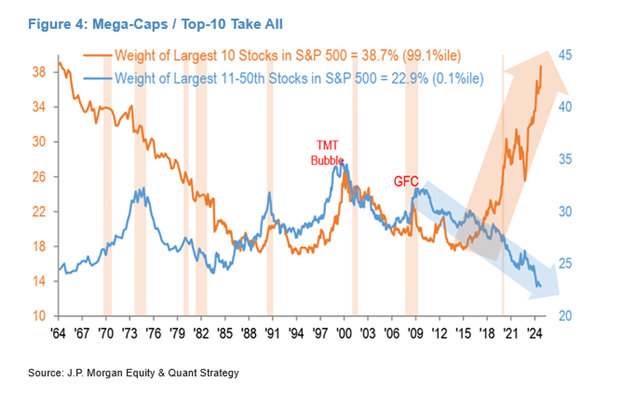
The concentration of the largest companies is at historic levels, and I believe market returns are likely to be spread over more companies going forward. Decelerating earnings growth for the Magnificent 7 may trigger a reversal of past outperformance. The Mag 7 posted earnings growth of 34% in 2024, far outpacing the rest of the market. Earnings growth for these companies is expected to decelerate to 18% in 2025. If earnings growth expectations materialize, growth of the Mag 7 will be more in line with expected earnings growth in the healthcare and industrials sectors this year. Stock returns for the Mag 7 are unlikely to be multiples of the rest of the market when earnings growth is more similar to the rest of the market.
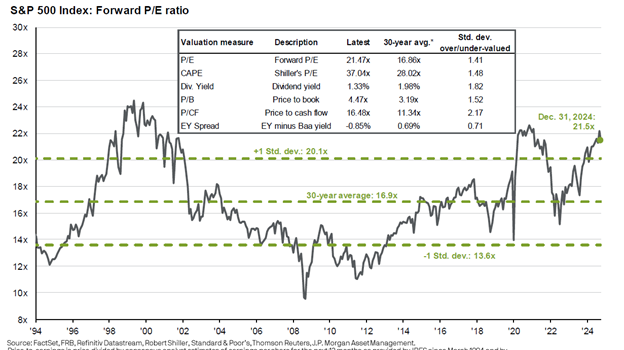
I expect the importance of balance in investment portfolios to extend beyond equities. The increase in interest rates over the last few years has led to bonds being a more attractive asset class. 2022 was a tough year in financial markets – stocks were down about 18% and bonds were down about 13%. Many pundits called that time period the death of the traditional balanced portfolio of 60% stocks and 40% bonds, as this simultaneous decline in both asset classes challenged the long-held belief that bonds provide a reliable hedge against stock market downturns. The table below is an interesting comparison between financial markets at the beginning of 2022 and now.
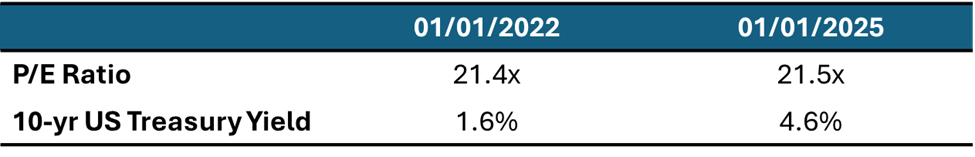
The valuation of the stock market was almost exactly the same three years ago, however investors received almost no support from bonds due to the 1.6% yield of the 10 year US Treasury. In 2022 stocks turned downward and interest rates increased, leading to negative returns in both stocks and bonds. Today the US 10 year US Treasury yields 4.6%, providing a solid yield and some cushion against rising rates.
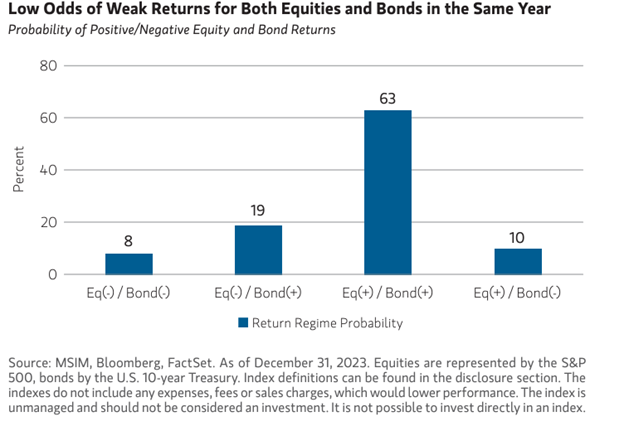
History has shown that years of negative returns in both stocks and bonds are rare. The data in the chart below goes back 200 years, and only 8% of the time both stocks and bonds have posted negative returns. 63% of the time stocks and bonds both post positive returns. The other 29%, one asset class is positive while the other is negative.
As seen in the chart below, stock markets are expensive in comparison to historical averages. Current valuation multiples do not prohibit continued positive returns, however it is comforting to have an attractive yield in bonds to potentially offset any downturns in equities.
Please see below for commentary on our investment portfolios and a summary of trading activity for the year.
Best wishes for a prosperous 2025!
Core Equity
For the second year in a row, Nvidia was the top performing stock in the portfolio. Other top performers included Ciena, Chart Industries, Amazon, JPMorgan Chase, and Brookfield. The worst performing stocks were Grocery Outlet, Aptiv, AES, and Archer-Daniels-Midland. Grocery Outlet and Archer-Daniels-Midland were both sold during the year, and we increased our positions in Aptiv and AES. Stryker is one of two companies added to the portfolio during the 4th quarter. Stryker is a global leader in medical technology with market-leading positions in orthopedic products, neurovascular devices, endoscopic systems, and critical care. The company targets revenue growth 2% – 3% above market growth and fits well with our goal to find high quality companies in industries with long-term tailwinds.
Recap of trading activity for the full year:
- New position: Adobe, Lonza, Chart Industries, Stryker, Constellation Brands
- Increase position size: Hershey, Aptiv, Prologis, Grocery Outlet, Adobe, IQVIA, Thermo Fisher Scientific, SLB, Microsoft, AES
- Excited position: Archer-Daniels-Midland, Columbus McKinnon, Grocery Outlet, Becton Dickinson, Hershey
- Decrease position size: AMD, Nvidia, Eaton, Ciena
Covered Call
Our Covered Call portfolio is designed to provide a higher level of income and a lower level of volatility than a typical equity portfolio. Income continued to be strong in 2024 with approximately 9.2% call premium plus approximately 2.7% dividends for an approximate 11.9% total income yield. Income yield over the last nine years has averaged approximately 10.8% and has been within the range of 9.5% to 12.0% each year.
Diversified Income
Top performers in our Diversified Income portfolio in 2024 included Williams, AT&T, IBM, and Old Republic. Laggards included LyondellBasell, Crown Castle, and UPS. The goal of the portfolio is to provide a sustainable income stream, and the portfolio generated an approximate income yield of 5.0% for the year. During the quarter we added Kenvue and Target to the portfolio. We believe both stocks offer solid, sustainable dividend yields at an attractive stock valuation.
Recap of trading activity for the full year:
- New positions: iShares 20+ Year Treasury Bond ETF, Kenvue, Target
- Increase position size: Bristol-Myers Squibb, Whirlpool, AT&T, Verizon, UPS, Pfizer, iShares Investment Grade Corporate Bond ETF, UPS,
Chevron - Exited positions: iShares Floating Rate Bond ETF, Telus, BCE
- Decreased position size: IBM, Novartis, Old Republic
Bonds
As discussed earlier, higher interest rates over the last two years have increased the attractiveness of bonds in a balanced portfolio. Our portfolio continues to focus on high-quality individual bonds with very low default risk. We ended 2024 with the portfolio yielding about 5.0% and an average time to maturity of slightly above five years.
Tom Searson, CFA
The analysis and performance information contained herein reflects that of portfolios used by Providence Capital Advisors, LLC, a Securities and Exchange Commission Registered Investment Advisor. This information should not be relied upon for tax purposes and is based upon sources believed to be reliable. No guarantee is made to the completeness or accuracy of this information. Providence Capital Advisors, LLC shall not be responsible for any trading decisions, damages, or other losses resulting from, or related to, the information, data, analyses or opinions contained herein or their use, which do not constitute investment advice, are provided as of the date written, are provided solely for informational purposes, and therefore are not an offer to buy or sell a security. This information has not been tailored to suit any individual.
Providence Capital Advisors, LLC does not guarantee the results of its advice or recommendations, or that the objectives of a strategy will be achieved. Portfolios offered by Providence Capital Advisors, LLC may not have contained and/or may not currently contain the same underlying holdings and may have been and/or may currently be managed according to rules or restrictions established by Providence Capital Advisors, LLC. The income numbers for Covered Call and Diversified Income are based on one portfolio in the composite that serves as the model portfolio. Actual income returns may be different for other portfolios. Employees of Providence Capital Advisors, LLC may have holdings in the securities and/or utilize the same portfolio strategies as presented herein.
Benchmark returns are used for comparative purposes only and are not intended to directly parallel the risk or investment style of the accounts included in our investments. The volatility of the indices compared herein may be materially different from that of the compared Providence Capital Advisors, LLC strategy. There is no guarantee that the strategies will outperform, or even match, benchmark returns over the long term.
This commentary contains certain forward-looking statements. Forward-looking statements involve known and unknown risks, uncertainties and other factors which may cause the actual results to differ materially and/or substantially from any future results, performance or achievements expressed or implied by those projected in the forward-looking statements for any reason.
Past performance is not indicative of future results. Therefore, no current or prospective client should assume that future performance of any specific investment or investment strategy (including the investments and/or investment strategies recommended or undertaken by Providence Capital Advisors, LLC) will be profitable or equal the corresponding indicated performance level(s). Different types of investments involve varying degrees of risk, and there can be no assurance that any specific investment will either be suitable or profitable for a client or prospective client’s investment portfolio. Historical performance results for investment indices and/or categories generally do not reflect the deduction of transaction and/or custodial charges, the deduction of an investment management fee, nor the impact of taxes, the payment of which would have the effect of decreasing historical performance results.