
16 Jul Q2 2024
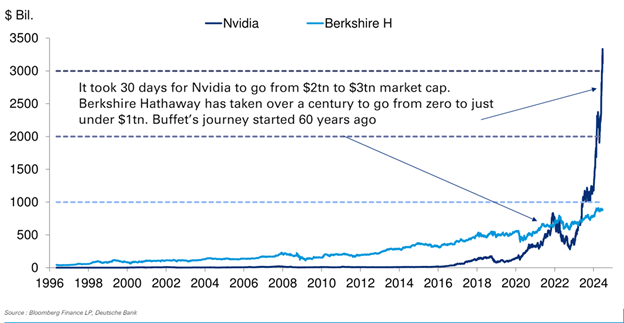
Nvidia briefly topped Microsoft in late June to become the world’s most valuable publicly traded company. It has been an astounding run for a company that wasn’t even in the top fifty largest companies just five years ago. The stock has returned 98% annually over the last five years including a 239% return in 2023 and 149% return during the first six months of 2024. The following two charts do a good job of framing the scale of the meteoric rise.
The first chart compares Nvidia to Warren Buffett’s Berkshire Hathaway. Buffett purchased Berkshire Hathaway in 1965, and over the next 60 years grew the company to a market capitalization of a little less than $1 trillion (roughly $890 billion). In comparison, Nvidia grew its market capitalization from $2 trillion to $3 trillion in about one month.
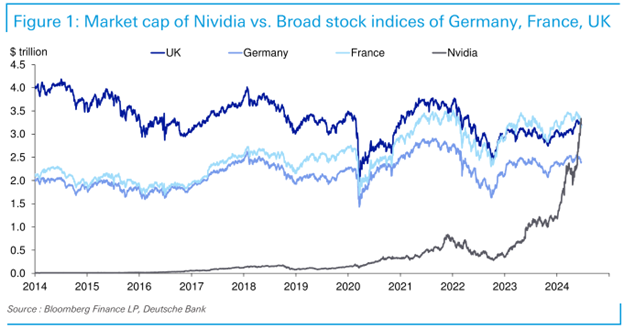
The second chart shows that Nvidia’s value is now greater than the value of all publicly traded stocks in Germany, France, and the United Kingdom.
So now that I hopefully have your attention, what is Nvidia? Nvidia invented graphics processing units (GPUs) in 1999. GPUs are semiconductors that, as the name suggests, were originally used for controlling the display of images. Gaming and computer-aided design were the original markets for the chips. In 2007 Nvidia added a software layer to GPUs called CUDA which allowed developers to program the chips for other functions, and GPUs excelled at processing large amounts of data. The demand for GPUs exploded over the last few years as companies began investing in artificial intelligence and machine learning. Nvidia’s GPUs are the key tool needed for building AI models due to their unique ability to be programmed using Nvidia’s proprietary programming software.
Nvidia, along with Microsoft, Apple, Alphabet (Google), Amazon, Meta (Facebook), and Tesla, make up the ‘Magnificent Seven’ that have been driving market returns. These seven companies were responsible for 60% of the S&P 500 return both during 2023 and the first half of 2024. Nvidia alone was responsible for 30% of the S&P 500 return during the first half of this year. The US stock market is close to its most concentrated levels in history, last reached in the late 1920s.
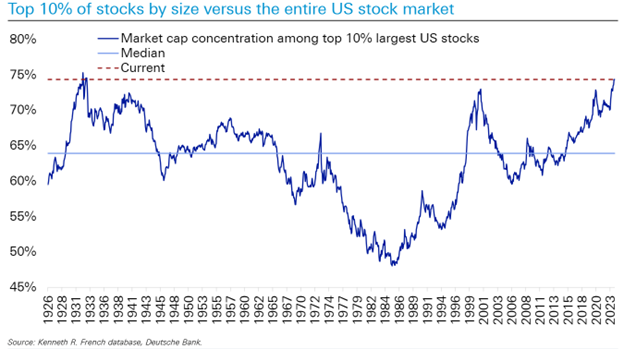
The next chart on market concentration goes one layer deeper by showing the five largest stocks in the S&P 500 rather than the top 10%.
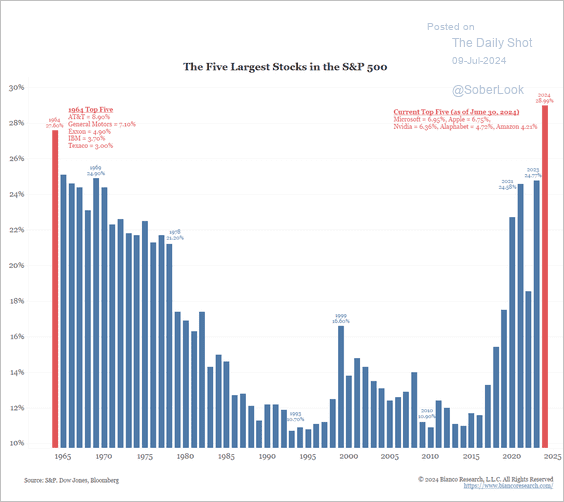
The S&P 500 is no longer a reflection of the large cap US stock market, rather it has transformed into an index dominated by a handful of stocks.
The future growth prospects of Nvidia are undoubtedly strong, however some caution is warranted on expectations of future stock returns. The first reason for caution is simply math. A company as large as Nvidia cannot continue to annually double in stock price indefinitely. At past stock price growth rates, the company would very quickly dominate the value of all stock markets in a nonsensical manner.
The second reason for caution is competition. Nvidia’s 4 largest customers are Microsoft, Meta, Alphabet, and Amazon. These companies are all developing their own internal semiconductors as potential replacements and/or complements to Nvidia GPUs. Nvidia has a wide moat due to their software advantage, but these companies have deep pockets, huge R&D budgets, and the motivation to be less dependent on one company for their GPUs. In addition to internally developed silicon at the large tech companies, other semiconductor companies such as AMD and Intel are improving their GPU offerings.
The third reason for caution is the potential for outside bottlenecks, namely power, to throttle the growth of AI-focused datacenters. AI-focused data centers require significantly higher levels of electricity than regular data centers, and our grid capacity and electricity generation are simply not ready to meet the demand.
The fourth reason for caution is that the high costs associated with AI and the likely long lead time until transformative changes are realized could lead to a slowdown in investment. Jim Covello, Head of Global Equity Research at Goldman Sachs, had an interesting take during a recent interview about AI, “replacing low-wage jobs with tremendously costly technology is basically the polar opposite of the prior technology transitions I’ve witnessed in my thirty years of closely following the tech industry.” AI may lead to transformative increases in productivity at some point in the future, but current advancements are hard to justify on a return on investment basis.
The preceding comments are not intended to be negative on Nvidia or AI, rather they are an attempt to add some caution about future return expectations. We own Nvidia in our Core Equity portfolio, originally purchasing the stock in July 2022. The outperformance of the stock caused it to be a larger and larger percentage of the total portfolio. In order to manage risk, we have trimmed the size of the position a few times over the last 12 months. Nvidia is still one of the five largest positions in the portfolio, but position sizing and risk management are key to long-term success. Having too large of a position in a stock that has been on a meteoric rise could lead to a disappointing outcome.
Please see below for portfolio commentary and trading activity.
Core Equity
For the third quarter in a row, Nvidia was the top performing stock in the portfolio. Other top performers included Apple, Alphabet, and Adobe. Laggards during the quarter were Grocery Outlet, Columbus McKinnon, Disney, and IQVIA. We did not purchase any new stocks during the quarter, but we did increase our weighting in four holdings and decrease our weighting in two holdings. Trading activity during the quarter:
- Increase position size: Prologis, Grocery Outlet, Adobe, IQVIA
- Decrease position size: Eaton, Nvidia
Covered Call
On average, five to six options expire each month in our Covered Call portfolio. If the option expires worthless, we typically sell another option on the same stock. If the stock price is above the option strike, and the underlying stock is called away, we typically replace the holding with a new covered call position. Trading activity during the quarter:
- New positions: Tyson Foods, Medtronic, CSX, ConocoPhillips, PNC, Zimmer Biomet, Amazon, Alphabet, Microchip Technology
- Option rewrites: Oracle, Starbucks, Cisco, Comcast, Johnson & Johnson, Tyson Foods, Electronic Arts, MetLife
- Positions called away: Johnson Controls, Wells Fargo, Exxon Mobil, NetApp, Quest Diagnostics, Morgan Stanley, Apple, Honeywell, Corning, Texas Instruments
Diversified Income
Top performing positions during the quarter included AT&T, Williams Companies, and Novartis. Laggards included Bristol-Myers Squibb, Whirlpool, and US Bancorp. We did not place any trades in the portfolio during the quarter.
Tom Searson, CFA
The analysis and performance information contained herein reflects that of portfolios used by Providence Capital Advisors, LLC, a Securities and Exchange Commission Registered Investment Advisor. This information should not be relied upon for tax purposes and is based upon sources believed to be reliable. No guarantee is made to the completeness or accuracy of this information. Providence Capital Advisors, LLC shall not be responsible for any trading decisions, damages, or other losses resulting from, or related to, the information, data, analyses or opinions contained herein or their use, which do not constitute investment advice, are provided as of the date written, are provided solely for informational purposes, and therefore are not an offer to buy or sell a security. This information has not been tailored to suit any individual.
Providence Capital Advisors, LLC does not guarantee the results of its advice or recommendations, or that the objectives of a strategy will be achieved. Portfolios offered by Providence Capital Advisors, LLC may not have contained and/or may not currently contain the same underlying holdings and may have been and/or may currently be managed according to rules or restrictions established by Providence Capital Advisors, LLC. The income numbers for Covered Call and Diversified Income are based on one portfolio in the composite that serves as the model portfolio. Actual income returns may be different for other portfolios. Employees of Providence Capital Advisors, LLC may have holdings in the securities and/or utilize the same portfolio strategies as presented herein.
Benchmark returns are used for comparative purposes only and are not intended to directly parallel the risk or investment style of the accounts included in our investments. The volatility of the indices compared herein may be materially different from that of the compared Providence Capital Advisors, LLC strategy. There is no guarantee that the strategies will outperform, or even match, benchmark returns over the long term.
This commentary contains certain forward-looking statements. Forward-looking statements involve known and unknown risks, uncertainties and other factors which may cause the actual results to differ materially and/or substantially from any future results, performance or achievements expressed or implied by those projected in the forward-looking statements for any reason.
Past performance is not indicative of future results. Therefore, no current or prospective client should assume that future performance of any specific investment or investment strategy (including the investments and/or investment strategies recommended or undertaken by Providence Capital Advisors, LLC) will be profitable or equal the corresponding indicated performance level(s). Different types of investments involve varying degrees of risk, and there can be no assurance that any specific investment will either be suitable or profitable for a client or prospective client’s investment portfolio. Historical performance results for investment indices and/or categories generally do not reflect the deduction of transaction and/or custodial charges, the deduction of an investment management fee, nor the impact of taxes, the payment of which would have the effect of decreasing historical performance results.