
31 Oct Q2 2022
The financial markets were driven by inflation and the related response from the Federal Reserve during the second quarter. During the quarter we received consumer price index (CPI) data for March, April, and May. All 3 data points showed inflation between 8.3% and 8.6%. This morning the news got worse when CPI for June was released showing inflation of 9.1%. These high inflation rates cause concern at the Federal Reserve that inflation may become entrenched, leading the Fed to increase the Fed Funds rate significantly and signal more significant increases are coming. The Fed increased the Fed Funds rate from 0.5% to 1.0% in May and then followed up in June with a 0.75% increase to 1.75%. The increase in June was the largest increase since 1994. The Fed has signaled another 0.75% increase later this month, which would bring the Fed Funds rate to 2.5%. Further rate hikes are likely, which would move monetary policy into a restrictive position. The fear permeating markets is that these rate increases will drive the economy to recession. Although the Federal Reserve believes the economy is strong enough to withstand these rate increases, they have communicated that bringing down inflation is more important than avoiding a recession, so interest rate increases are likely to continue until inflation pulls back.
Markets reacted violently to higher interest rates and an increased chance of recession. The S&P 500 entered bear market territory (decline of 20%) in mid-June. The table below includes some interesting data on returns after a 20% pullback:
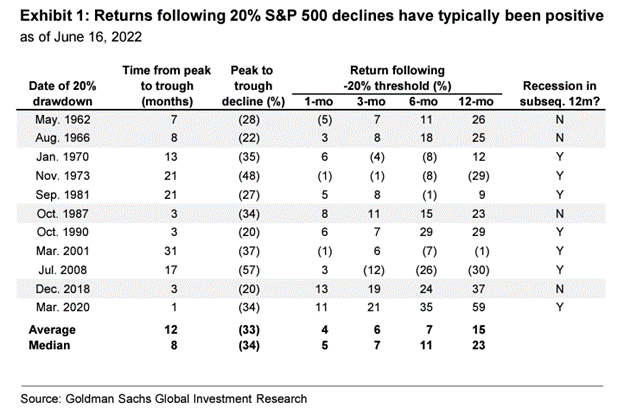
Six months after a 20% drop, the average return is 7% and median is 11%. Twelve months after a 20% drop, the average return is 15% and the median return is 23%. This data certainly does not mean the stock market will be higher six to twelve months from now. There are incidences of negative 1,3,6, and 12 month returns in the table. The more important takeaway, in my opinion, is that stock prices in a bear market incorporate a significant amount of future negative outcomes. Slow growth or a mild recession is likely mostly priced into current stock prices because equity markets are a discount mechanism for future economic expectations.
As we look towards the back half of the year, four factors point towards softening inflation numbers. The first is commodity prices. Many commodity prices have pulled back since peaking in early to mid-June. Oil, copper, and corn are all down about 20% since that time. Natural gas is down about 33%. Aluminum peaked earlier in the year and is down about 40%. Lumber also peaked earlier and is down over 50%. The second factor is excess inventory at retailers. Consumer preferences shifted quickly during the quarter, leaving retailers with excess inventory in some categories. Sales and discounts in these products help offset inflation in other areas. The third factor is a strong US Dollar, which is at its highest level in about 20 years. The high dollar level reduces the cost of imported goods, which should help ease inflation. Finally, supply chain pressures are easing. For example, ocean freight costs are down over 30%, and the backlog of container ships waiting off the Southern California coast is down over 50%.
Markets are likely to walk a tightrope in the second half of the year, balancing inflation, interest rates, and growth. Please see below for more information about our three equity portfolios during the quarter.
Core Equity
The top performing stock in the Core Equity portfolio was Grocery Outlet. Grocery Outlet is a discount grocer that specializes in selling name-brand products at significant discounts compared to a traditional grocer. This is enabled by a differentiated and flexible buying program. The stock bounced back strongly after being our worst performing holding last year. Last year the company was hurt by Covid resurgences which caused customers to decrease the number of stores they visit. In addition, government stimulus and strong economic growth decreased the need for consumers to find bargains. The shift in the economic backdrop sets up well for the discount grocer, as consumers look to save money on everyday items to help offset inflation. Booz Allen Hamilton, Pfizer, and Constellation Brands also posted positive returns during the quarter. The worst performing stocks were Amazon, Target, Columbus McKinnon, and Disney.
Trading activity during the quarter:
- New positions – Booz Allen Hamilton and Aptiv
- Increased position size – Ciena and Prologis
- Decreased position size – Eaton, Pfizer, Constellation Brands, Honeywell, and Grocery Outlet
Covered Call
On average, five to six options expire each month in our covered call portfolio. If the option expires worthless, we typically sell another option on the same stock. If the stock price is above the option strike, and the underlying stock is called away, we typically replace the holding with a new covered call position.
Trading activity during the quarter:
- New positions – Lowe’s and Texas Instruments
- Positions called away – Walmart and Merck
- Option rewrites – Apple, TJX Companies, Intel, PepsiCo, Citigroup, Baxter, State Street, Starbucks, Disney, Medtronic, Cisco, Corning, and Emerson
Diversified Income
Top performing holdings in the Diversified Income portfolio were Valero, AT&T, General Mills, and Merck. Laggards were Cisco, KeyCorp, and Broadcom.
Trading activity during the quarter:
- New positions – Whirlpool and iShares 1-5 year investment grade corporate bond ETF
- Increased position size – Ares Capital Corp, STORE Capital, Verizon, Novartis, Bank of America preferred stock Series QQ
- Exited positions – 3M and Valero
- Decreased position size – Abbvie
Tom Searson, CFA
The analysis and performance information contained herein reflects that of portfolios used by Providence Capital Advisors, LLC, a Securities and Exchange Commission Registered Investment Advisor. This information should not be relied upon for tax purposes and is based upon sources believed to be reliable. No guarantee is made to the completeness or accuracy of this information. Providence Capital Advisors, LLC shall not be responsible for any trading decisions, damages, or other losses resulting from, or related to, the information, data, analyses or opinions contained herein or their use, which do not constitute investment advice, are provided as of the date written, are provided solely for informational purposes, and therefore are not an offer to buy or sell a security. This information has not been tailored to suit any individual.
Providence Capital Advisors, LLC does not guarantee the results of its advice or recommendations, or that the objectives of a strategy will be achieved. Portfolios offered by Providence Capital Advisors, LLC may not have contained and/or may not currently contain the same underlying holdings and may have been and/or may currently be managed according to rules or restrictions established by Providence Capital Advisors, LLC. The income numbers for Covered Call and Diversified Income are based on one portfolio in the composite that serves as the model portfolio. Actual income returns may be different for other portfolios. Employees of Providence Capital Advisors, LLC may have holdings in the securities and/or utilize the same portfolio strategies as presented herein.
Benchmark returns are used for comparative purposes only and are not intended to directly parallel the risk or investment style of the accounts included in our investments. The volatility of the indices compared herein may be materially different from that of the compared Providence Capital Advisors, LLC strategy. There is no guarantee that the strategies will outperform, or even match, benchmark returns over the long term.
This commentary contains certain forward-looking statements. Forward-looking statements involve known and unknown risks, uncertainties and other factors which may cause the actual results to differ materially and/or substantially from any future results, performance or achievements expressed or implied by those projected in the forward-looking statements for any reason.
Past performance is not indicative of future results. Therefore, no current or prospective client should assume that future performance of any specific investment or investment strategy (including the investments and/or investment strategies recommended or undertaken by Providence Capital Advisors, LLC) will be profitable or equal the corresponding indicated performance level(s). Different types of investments involve varying degrees of risk, and there can be no assurance that any specific investment will either be suitable or profitable for a client or prospective client’s investment portfolio. Historical performance results for investment indices and/or categories generally do not reflect the deduction of transaction and/or custodial charges, the deduction of an investment management fee, nor the impact of taxes, the payment of which would have the effect of decreasing historical performance results.