
16 Oct Q3 2024
The most noteworthy event in financial markets during the third quarter was the Federal Reserve lowering the Fed Funds rate from 5.5% to 5.0% on September 18th. This is the first time the Fed Funds rate has been lowered since the pandemic in 2020. The Fed increased rates steadily from early 2022 through mid-2023, and then left the rate constant at 5.5% for a little over a year.
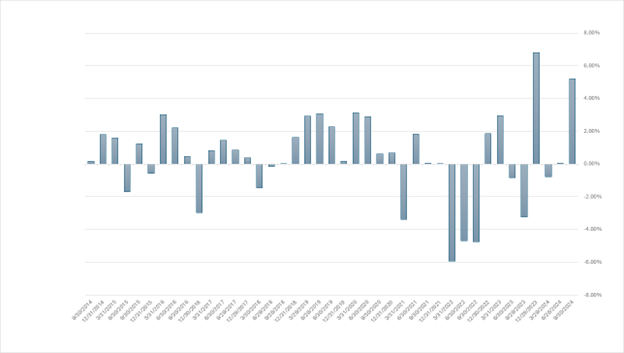
Financial markets anticipated the Fed’s move, and market interest rates were on a downward trend from the spring until mid-September. During the third quarter, the US 10 year Treasury decreased about 0.6%, going from 4.4% to 3.8%. The decrease in rates had two notable impacts in financial markets. The first is strong bond market returns. The third quarter was the second largest quarterly return for the Bloomberg Aggregate Bond Index in the last 25 years. The chart below only shows the last 10 years, but you can see how last quarter and the fourth quarter of 2023 were outliers for bond market returns.
The second impact is a rotation into defensive and high dividend paying stocks. Growth stocks, particularly the “Magnificent 7”, have been driving market returns for an extended period. Returns for the Magnificent 7 were a mixed bag during the third quarter, but growth stocks overall still posted positive returns. Many defensive, dividend-paying stocks outpaced growth stocks during the quarter. As interest rates decreased, investors rotated into high dividend paying stocks due to the lower income offered by bonds.
Switching gears completely, it would be hard for me to wrap up this newsletter without commenting on the upcoming election. Many of you are likely exhausted by the constant barrage of political commentary in the media. I certainly am. I would argue that the deepening political polarization in our country is not good for our collective health. I understand and respect that people care deeply about the direction of our country, however our job as your investment team is to strip emotion out of the investment decision making process and make solid long-term decisions for our clients. With that in mind, I encourage you to take a look at the chart below created by Goldman Sachs:
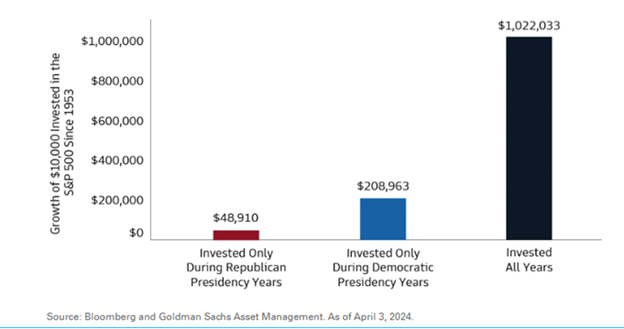
The point of this chart is not whether the red bar or blue bar is taller. 1953 is admittedly a strange year to pick as a starting point, and I’m sure the starting date could be altered to skew the results of red vs. blue. In fact, a recent Barron’s article referenced a Vanguard study going back to 1860. This study found that a portfolio of 60% stocks and 40% bonds returned 8.1% annually under Republican presidents and 7.7% annually under Democrat presidents. Getting back to the main point of the chart above, the black bar is the key to focus on, as the increased returns of staying invested highlights the negative consequences that emotions can bring to an investment portfolio. Investing only when your political party is in power can lead to significant lost opportunities. Albert Einstein is widely credited with calling compound interest the eighth wonder of the world. Market timing breaks the power of compounding, typically with negative ramifications.
Some of you may read the above commentary and think that history doesn’t apply because this election is different from preceding ones. Please understand that I’m not trying to say the election doesn’t matter, rather that financial markets absorb negative impacts regularly – war, terrorism, natural disasters, commodity price spikes, etc. Negative market shocks are typically the worst time to sell.
The key to success during turbulent times is to remain unemotional and to invest in high-quality companies with strong management teams that can navigate various macroeconomic environments. That is how we have always invested, and we will continue to do so regardless of the outcome on November 5th.
Please see below for portfolio commentary and trading activity.
Core Equity
The top performing stocks during the quarter were Brookfield, Ciena, Zebra, and Home Depot. Laggards during the quarter were Grocery Outlet, Alphabet (Google), SLB, and NXP Semiconductors. We initiated a new position in Chart Industries during the quarter. Chart manufactures and services equipment used in the processing and transportation of liquified gases. Our investment in Chart is centered on the need for a diversification of energy sources and the supply/demand imbalance in the liquefied natural gas market. Abundant natural gas in areas such as North America and the Middle East is liquefied and transported to areas such as Europe and Asia with high demand and low supply. Trading activity during the quarter:
- Initiated new position: Chart Industries
- Increase position size: Aptiv, Thermo Fisher Scientific, SLB
- Excited position: Columbus McKinnon, Grocery Outlet
- Decrease position size: Ciena
Covered Call
On average, five to six options expire each month in our Covered Call portfolio. If the option expires worthless, we typically sell another option on the same stock. If the stock price is above the option strike, and the underlying stock is called away, we typically replace the holding with a new covered call position. Trading activity during the quarter:
- New positions: Hewlett Packard Enterprise, Emerson Electric, Sysco, State Street, Dow, Tyson Foods
- Option rewrites: Medtronic, Starbucks, Comcast, Nike, Cisco Systems, CSX, Amazon, Zimmer Biomet, ConocoPhillips, Electronic Arts, Hewlett Packard Enterprise, Alphabet, Emerson Electric
- Positions called away: Oracle, PNC, Johnson & Johnson, Tyson Foods, Medtronic
Diversified Income
The Diversified Income portfolio had a particularly strong quarter as lower interest rates and concern over a slowing economy led to a rotation into defensive stocks and solid bond returns. Top performing positions during the quarter included IBM, Bristol-Myers Squibb and Crown Castle. Laggards included Chevron, UPS, and LyondellBasell. Trading activity during the quarter:
- Increased position size: UPS, Chevron
- Decreased position size: Novartis
Tom Searson, CFA
The analysis and performance information contained herein reflects that of portfolios used by Providence Capital Advisors, LLC, a Securities and Exchange Commission Registered Investment Advisor. This information should not be relied upon for tax purposes and is based upon sources believed to be reliable. No guarantee is made to the completeness or accuracy of this information. Providence Capital Advisors, LLC shall not be responsible for any trading decisions, damages, or other losses resulting from, or related to, the information, data, analyses or opinions contained herein or their use, which do not constitute investment advice, are provided as of the date written, are provided solely for informational purposes, and therefore are not an offer to buy or sell a security. This information has not been tailored to suit any individual.
Providence Capital Advisors, LLC does not guarantee the results of its advice or recommendations, or that the objectives of a strategy will be achieved. Portfolios offered by Providence Capital Advisors, LLC may not have contained and/or may not currently contain the same underlying holdings and may have been and/or may currently be managed according to rules or restrictions established by Providence Capital Advisors, LLC. The income numbers for Covered Call and Diversified Income are based on one portfolio in the composite that serves as the model portfolio. Actual income returns may be different for other portfolios. Employees of Providence Capital Advisors, LLC may have holdings in the securities and/or utilize the same portfolio strategies as presented herein.
Benchmark returns are used for comparative purposes only and are not intended to directly parallel the risk or investment style of the accounts included in our investments. The volatility of the indices compared herein may be materially different from that of the compared Providence Capital Advisors, LLC strategy. There is no guarantee that the strategies will outperform, or even match, benchmark returns over the long term.
This commentary contains certain forward-looking statements. Forward-looking statements involve known and unknown risks, uncertainties and other factors which may cause the actual results to differ materially and/or substantially from any future results, performance or achievements expressed or implied by those projected in the forward-looking statements for any reason.
Past performance is not indicative of future results. Therefore, no current or prospective client should assume that future performance of any specific investment or investment strategy (including the investments and/or investment strategies recommended or undertaken by Providence Capital Advisors, LLC) will be profitable or equal the corresponding indicated performance level(s). Different types of investments involve varying degrees of risk, and there can be no assurance that any specific investment will either be suitable or profitable for a client or prospective client’s investment portfolio. Historical performance results for investment indices and/or categories generally do not reflect the deduction of transaction and/or custodial charges, the deduction of an investment management fee, nor the impact of taxes, the payment of which would have the effect of decreasing historical performance results.